

The market is near its highs. Your watchlist is not.
That does not necessarily mean you picked every stock wrong. It may mean the benchmark and the average holding are telling different stories.
A handful of large companies can carry a capitalization-weighted index even while many smaller constituents remain well below their peaks. Investors watching only the headline see resilience. Investors holding the rest of the market experience something closer to a prolonged drawdown.
The useful question is whether that gap creates an opportunity or reveals a market becoming more dependent on fewer winners.
Both outcomes are possible. Distinguishing them requires looking at participation, earnings and financing conditions together.
Key Takeaways
- An index can approach its high without most constituents doing the same. Company size determines how much each move matters to a capitalization-weighted benchmark.
- Kobeissi's October snapshot reported 84% of S&P 500 constituents at least 10% below their all-time highs. That measures drawdown, not how many stocks fell over one shared period.
- Narrow leadership is neither an automatic crash signal nor proof of a bargain. The next test is whether earnings remain credible and buying spreads beyond the leaders.
- Lower oil prices could ease inflation pressure, but cheaper energy does not guarantee immediate rate cuts or stronger corporate profits.
- For crypto, the transferable lesson is about breadth: strength in a benchmark is not evidence that liquidity has reached the assets in your portfolio.
Why Can the Index and Your Portfolio Tell Different Stories?
The S&P 500 is not a vote in which every company gets equal influence. It is weighted by float-adjusted market capitalization. A move in a very large constituent can outweigh moves in several much smaller ones.
S&P Dow Jones Indices describes the benchmark as covering approximately 80% of available U.S. equity market capitalization. It represents a large share of market value, not the experience of every listed company or every investor.
Consider a simplified example, not a description of current index weights. Suppose ten companies represent 40% of a portfolio and gain 20%, while everything else represents 60% and falls 5%. The portfolio still rises 5%: an eight-percentage-point contribution from the leaders offsets a three-point drag from the rest.
The headline return is correct. So is the observation that most holdings struggled.
This matters when choosing a position. Buying the benchmark is partly a decision to own its largest companies at their current weights. Buying a basket of laggards is a different trade, with a different earnings mix and sensitivity to financing costs.
One is not automatically a cheaper version of the other. A laggard can remain weak because its business is deteriorating, not because the market forgot to buy it.
What Does the “Stealth Bear Market” Data Actually Measure?
In its October article, The Kobeissi Letter reported that 84% of S&P 500 stocks were at least 10% below their all-time highs and 59% were at least 20% below them. Its breadth chart credits Bloomberg.
These are publisher-reported calculations. Whales has not independently reconstructed the constituent-level dataset. They are useful evidence of dispersion, but their definition matters as much as their size.
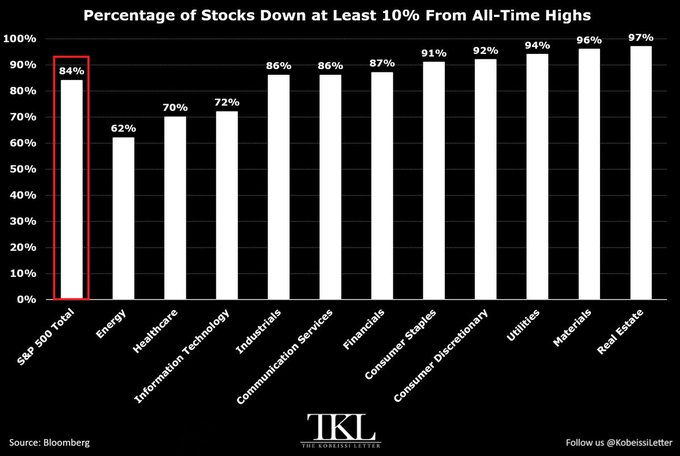
Each stock reached its peak at a different time. A company can be far below an old high while rising strongly this year. Another can sit just below its high while its recent trend has weakened.
The thresholds are also nested. Stocks down more than 20% are already included in the group down more than 10%. Adding those percentages would double-count the same companies.
And a 20% decline from a constituent's own peak does not establish that the index itself is in a bear market. It describes individual drawdowns inside the benchmark.
For a cleaner view of current participation, pair peak-distance statistics with returns over the same dates, the share of stocks above their moving averages and the balance of advancing versus declining issues. A single breadth number should not carry the whole thesis.
Ten Stocks Driving the Rally Is a Concentration Signal, Not a Forecast
Kobeissi also reported that ten stocks generated roughly 70% of the S&P 500's gain after the March 30 bottom. The accompanying contribution chart credits Nomura.
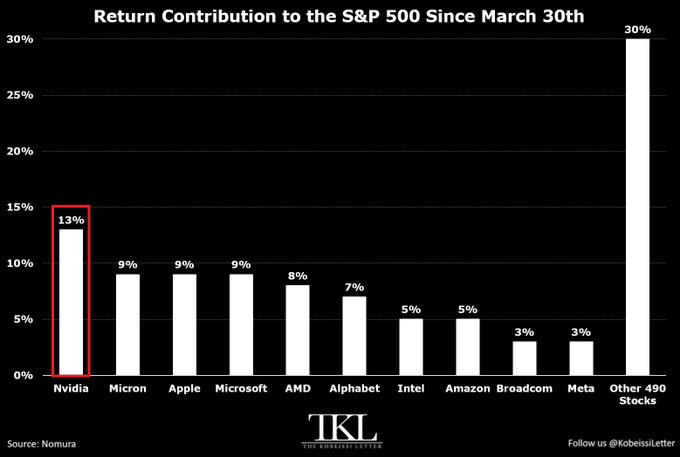
That distinction prevents a common misreading. A bar showing 13% contribution does not mean the company returned 13%. It means it supplied that share of the benchmark's total gain during the selected interval.
Concentration can reflect genuine earnings leadership. If a small set of companies captures a disproportionate share of profit growth, investors can rationally allocate more capital to them.
But it also makes the benchmark more dependent on those businesses meeting expectations. A disappointing earnings report from a heavily weighted leader matters more than the same disappointment at a minor constituent.
The March starting point adds another limitation. A rally measured from a local low describes the rebound from that low. It does not tell you who led year to date, who led over the previous year or what the next six months will look like.
Use contribution to identify where risk and performance are concentrated. Do not use it as a shortcut to either “sell the leaders” or “the laggards must catch up.”
A Stock Can Rise While Its Valuation Falls
Price and valuation are not interchangeable. If earnings grow faster than the share price, the price-to-earnings multiple declines even as shareholders make money.
For illustration, suppose a stock rises from $100 to $120 while earnings per share increase from $4 to $6. Its P/E falls from 25 times to 20 times. Those are hypothetical figures, but they explain how a higher price can coexist with a lower multiple.
The difficult part is deciding whether the earnings denominator is durable.
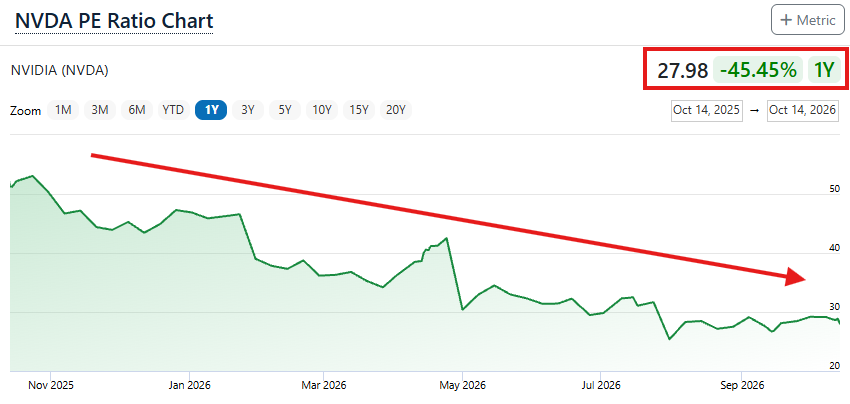
Trailing P/E uses past earnings. Forward P/E uses forecasts. Mixing them can make two assets appear similarly valued when they are not being measured on the same basis.
Even matching forward multiples is not enough. Forecasts can rise quickly during a strong spending cycle and fall just as quickly if customers cut budgets. Capital intensity, margins, cash conversion and customer concentration affect how much confidence those estimates deserve.
For AI-linked companies, the practical checks are whether demand turns into recognized revenue, whether that revenue produces cash and whether customers can fund the next round of spending without increasingly expensive financing.
A lower multiple supports a valuation argument only if the earnings survive. It is not independent evidence that the stock is cheap.
Can Cheaper Oil Turn a Narrow Rally Into a Broad One?
There is a plausible path. Lower energy costs can ease household pressure, improve margins for energy users and reduce one source of inflation. Financing-sensitive sectors may benefit if interest-rate expectations also fall.
The starting conditions are not hypothetical. The September CPI release, published October 14, showed headline inflation of 3.7% year over year and core inflation of 2.6%. Gasoline rose 9.1% over the month and accounted for more than half of the monthly headline increase.
The Federal Reserve's September 16 statement raised its target range by 25 basis points to 3.75%–4.00%. That is an observed policy decision, not a guarantee about the next meeting.
Oil relief could help reverse part of this pressure. It would not remove every constraint at once.
Energy might fall because supply improves, which can support growth. It might also fall because demand weakens, which can hurt earnings. The same oil-price move can therefore have very different implications.
Lower inflation also does not force an immediate central-bank pivot. Policymakers consider the persistence of price pressures, employment and broader activity. The Fed's formal inflation objective is measured using PCE inflation, so comparing headline CPI directly with the 2% objective is shorthand, not an exact target comparison.
A geopolitical improvement is a potential catalyst. It becomes a stronger investment case when lower costs, easing financing conditions and credible earnings forecasts begin moving together.
The Most Useful Breadth Check Is Relative Performance
Start by comparing the capitalization-weighted S&P 500 with its equal-weight counterpart over identical dates and with the same return convention.
S&P's Equal Weight Index holds the same constituents but resets each company to approximately 0.2% at quarterly rebalances. It reduces the influence of the largest names, making it a useful comparison for participation.
If the headline benchmark rises while equal weight repeatedly underperforms, leadership remains narrow. If equal weight begins outperforming alongside a rising index, participation is broadening. Neither observation is a complete trading system.
Then check financing stress. The ICE BofA U.S. High Yield option-adjusted spread series on FRED stood at 3.23 percentage points on October 15, compared with 3.11 on October 9. The change is a reason to monitor credit, not enough by itself to declare a crisis.
This spread measures compensation above a Treasury curve for riskier corporate debt. It is not the borrowers' total interest rate. Changes in both Treasury yields and spreads matter for financing conditions.
Finally, check whether earnings improvements are spreading across sectors rather than depending on a few companies. Breadth without earnings can be a short-lived rebound. Earnings without broader participation can sustain a narrow rally for longer than bearish traders expect.
The Crypto Parallel Is Useful, but It Is Not an Altseason Call
Crypto traders know this gap between benchmark performance and portfolio experience. Bitcoin strength does not establish that smaller tokens have fresh buyers.
That is a structural comparison, not a claim that today's equity breadth predicts crypto returns. Companies have earnings and cash flows; tokens have different value-capture mechanisms, supply schedules and market structures.
The shared mistake is using strength at the top as evidence that capital has already reached everything below it. Whales' altcoin-season guide explains why rotation needs evidence beyond a rising benchmark.
For an altcoin basket, compare returns against BTC over the same interval, then examine spot volume, usable order-book depth and scheduled supply. A rally led by leverage can look broad until funding conditions turn.
Market capitalization is not execution capacity. A token can display a large valuation while a modest order moves its price substantially. The distinction between price impact and slippage matters more than how impressive its market-cap ranking looks.
The same discipline applies before TGE. A pre-market quote reflects trading in that particular market, not proof that a wider rally will rescue the launch valuation. Check actual fills, liquidity and unlocks using the pre-market evaluation framework.
Three Outcomes to Watch From Here
Earnings-led broadening
The strongest improvement would be a rising benchmark accompanied by stronger equal-weight performance, more sectors participating and stable or improving financing conditions. Earnings revisions should support the move rather than chase it after the fact.
In that setting, laggards with improving businesses may deserve a closer look. The key is the change in conditions, not the distance from their old peaks.
More of the same narrow leadership
Large companies keep delivering while the rest struggle with margins or refinancing. The index holds up, but the broad catch-up trade continues to disappoint.
This scenario can persist without an imminent index collapse. It challenges the assumption that diversification into weaker businesses automatically creates upside.
Leadership fails before the rest recover
Earnings estimates fall, leaders lose support and credit conditions deteriorate. Laggards do not gain relative strength because they are recovering; they merely fall less than the former winners.
That is why relative and absolute performance must be read together. An equal-weight ratio can improve while both portfolios lose money.
These are conditional paths, not assigned probabilities. A decision becomes more robust when several independent signals agree and stays limited when they conflict.
Watch Participation, Not the Promise of Catch-Up
The strongest argument in a narrow market is not that everything below its high must recover. It is that some businesses may improve before the benchmark reveals that improvement clearly.
The weakest argument is buying a drawdown and calling it a discount without checking what happened to earnings, financing or supply.
An index near its high can coexist with real opportunities and real damage underneath. Separate them by tracking who is gaining relative strength, whether profits support the move and whether liquidity remains available when the trade gets crowded.
The next useful signal is not another record on the headline screen. It is evidence that more of the market can sustain the advance.
Disclaimer: This article is for informational purposes only and is not financial advice. Equities, crypto assets and pre-market positions involve substantial risk. Market snapshots and analyst forecasts can change.
Frequently Asked Questions
Is the S&P 500 in a bear market if most stocks are far below their highs?
Not necessarily. The index and individual constituents have separate price histories. “Stealth bear market” describes weakness beneath the headline benchmark; it is not a standardized index classification. Also distinguish all-time-high drawdowns from 52-week-high drawdowns and returns over a common period.
Does weak market breadth predict a crash?
No single breadth indicator reliably determines the next market move. Narrow leadership can persist when the leaders keep producing earnings. Risk rises when weakening participation coincides with deteriorating earnings, tighter financing and failed support in the largest constituents.
Is equal weight always better than capitalization weight?
No. Equal weight reduces mega-cap influence but changes sector exposures and introduces different size and rebalancing effects. It can underperform when large companies lead. Use it as a participation check, not an automatically superior investment.
Does a lower P/E mean a stock is cheaper?
Only relative to its earnings basis. Confirm whether the multiple is trailing or forward, compare like with like and test whether the earnings are sustainable. A falling forward P/E can reverse if analysts later cut forecasts.
Does a broader stock rally guarantee an altcoin rally?
No. Better global risk appetite may help, but crypto still needs its own demand and liquidity. Token unlocks, leverage, value capture and order-book depth can overpower a favorable equity backdrop. Confirm rotation in the assets you trade rather than importing a signal from another market.