


Some perpetual futures exchanges now let traders take long or short positions linked to the prices of stocks, gold, and market indices. Traders do not buy the underlying asset. They trade its price movements using a familiar crypto instrument.
This is no longer a small experiment. According to a16z crypto, the venues in its dataset processed $117.3B in RWA perp volume in August 2026, 44x as much as a year earlier. More strikingly, equities had overtaken commodities as the most traded asset class in that dataset.
What are traders finding in these contracts? And when billions of dollars change hands each month, does that actually make it easy to enter or exit a trade?
TL;DR
- In a16z's tracked venues, August 2026 volume reached $117.3B and open interest reached $4.8B. Equities accounted for 48% of volume, commodities for 28%, and indices for 18%.
- Onchain venues handled 86% of that tracked volume. Pyth uses a different dataset and reports a much larger total, so 86% should not be treated as the onchain share of the entire market.
- HIP-3 makes it easier for builders to launch new perp markets. A listed pair still needs a deep enough order book and a reliable price outside regular market hours.
- RWA perps give traders another way to react to news. These markets still have to prove that they can maintain liquidity, reasonable costs, and returning traders after the initial excitement fades.
Stocks Are Trading on Perp Exchanges, but What Is a Trader Actually Buying?
Before looking at volume, it helps to clear up a common misconception: a stock perp is not a share transferred onto a blockchain.
Depending on how it is issued, a tokenized stock may carry certain rights linked to the underlying asset. A stock perp is simply a contract tied to a price. A trader can go long or short without becoming a shareholder. Whales explains the different ownership structures in its guide to RWAs, while its guide to perp DEXs covers margin and funding.
Two people may follow the same stock for different reasons. One wants to own it for years. The other wants to trade the market's reaction to an earnings report over a few hours. For the second trader, getting into and out of a position matters more than ownership rights.
Crypto traders can use capital already on an exchange, go long or short, and, on some venues, trade outside traditional market hours. Dune draws a clear distinction between tokens tied to assets and contracts tied to prices. In the gold and onchain equity data examined by Dune, perps made up most of the trading volume.
Placing an order on a Sunday night only solves half the problem, though. The other half is how the price is set at that hour and how many traders are willing to take the other side.
Why Have Equities Overtaken Commodities?
A year ago, RWA perp trading was dominated by commodities, which accounted for 84% of volume. By August 2026, their share had fallen to 28%, while equities had risen to 48% and indices to 18%, according to a16z.
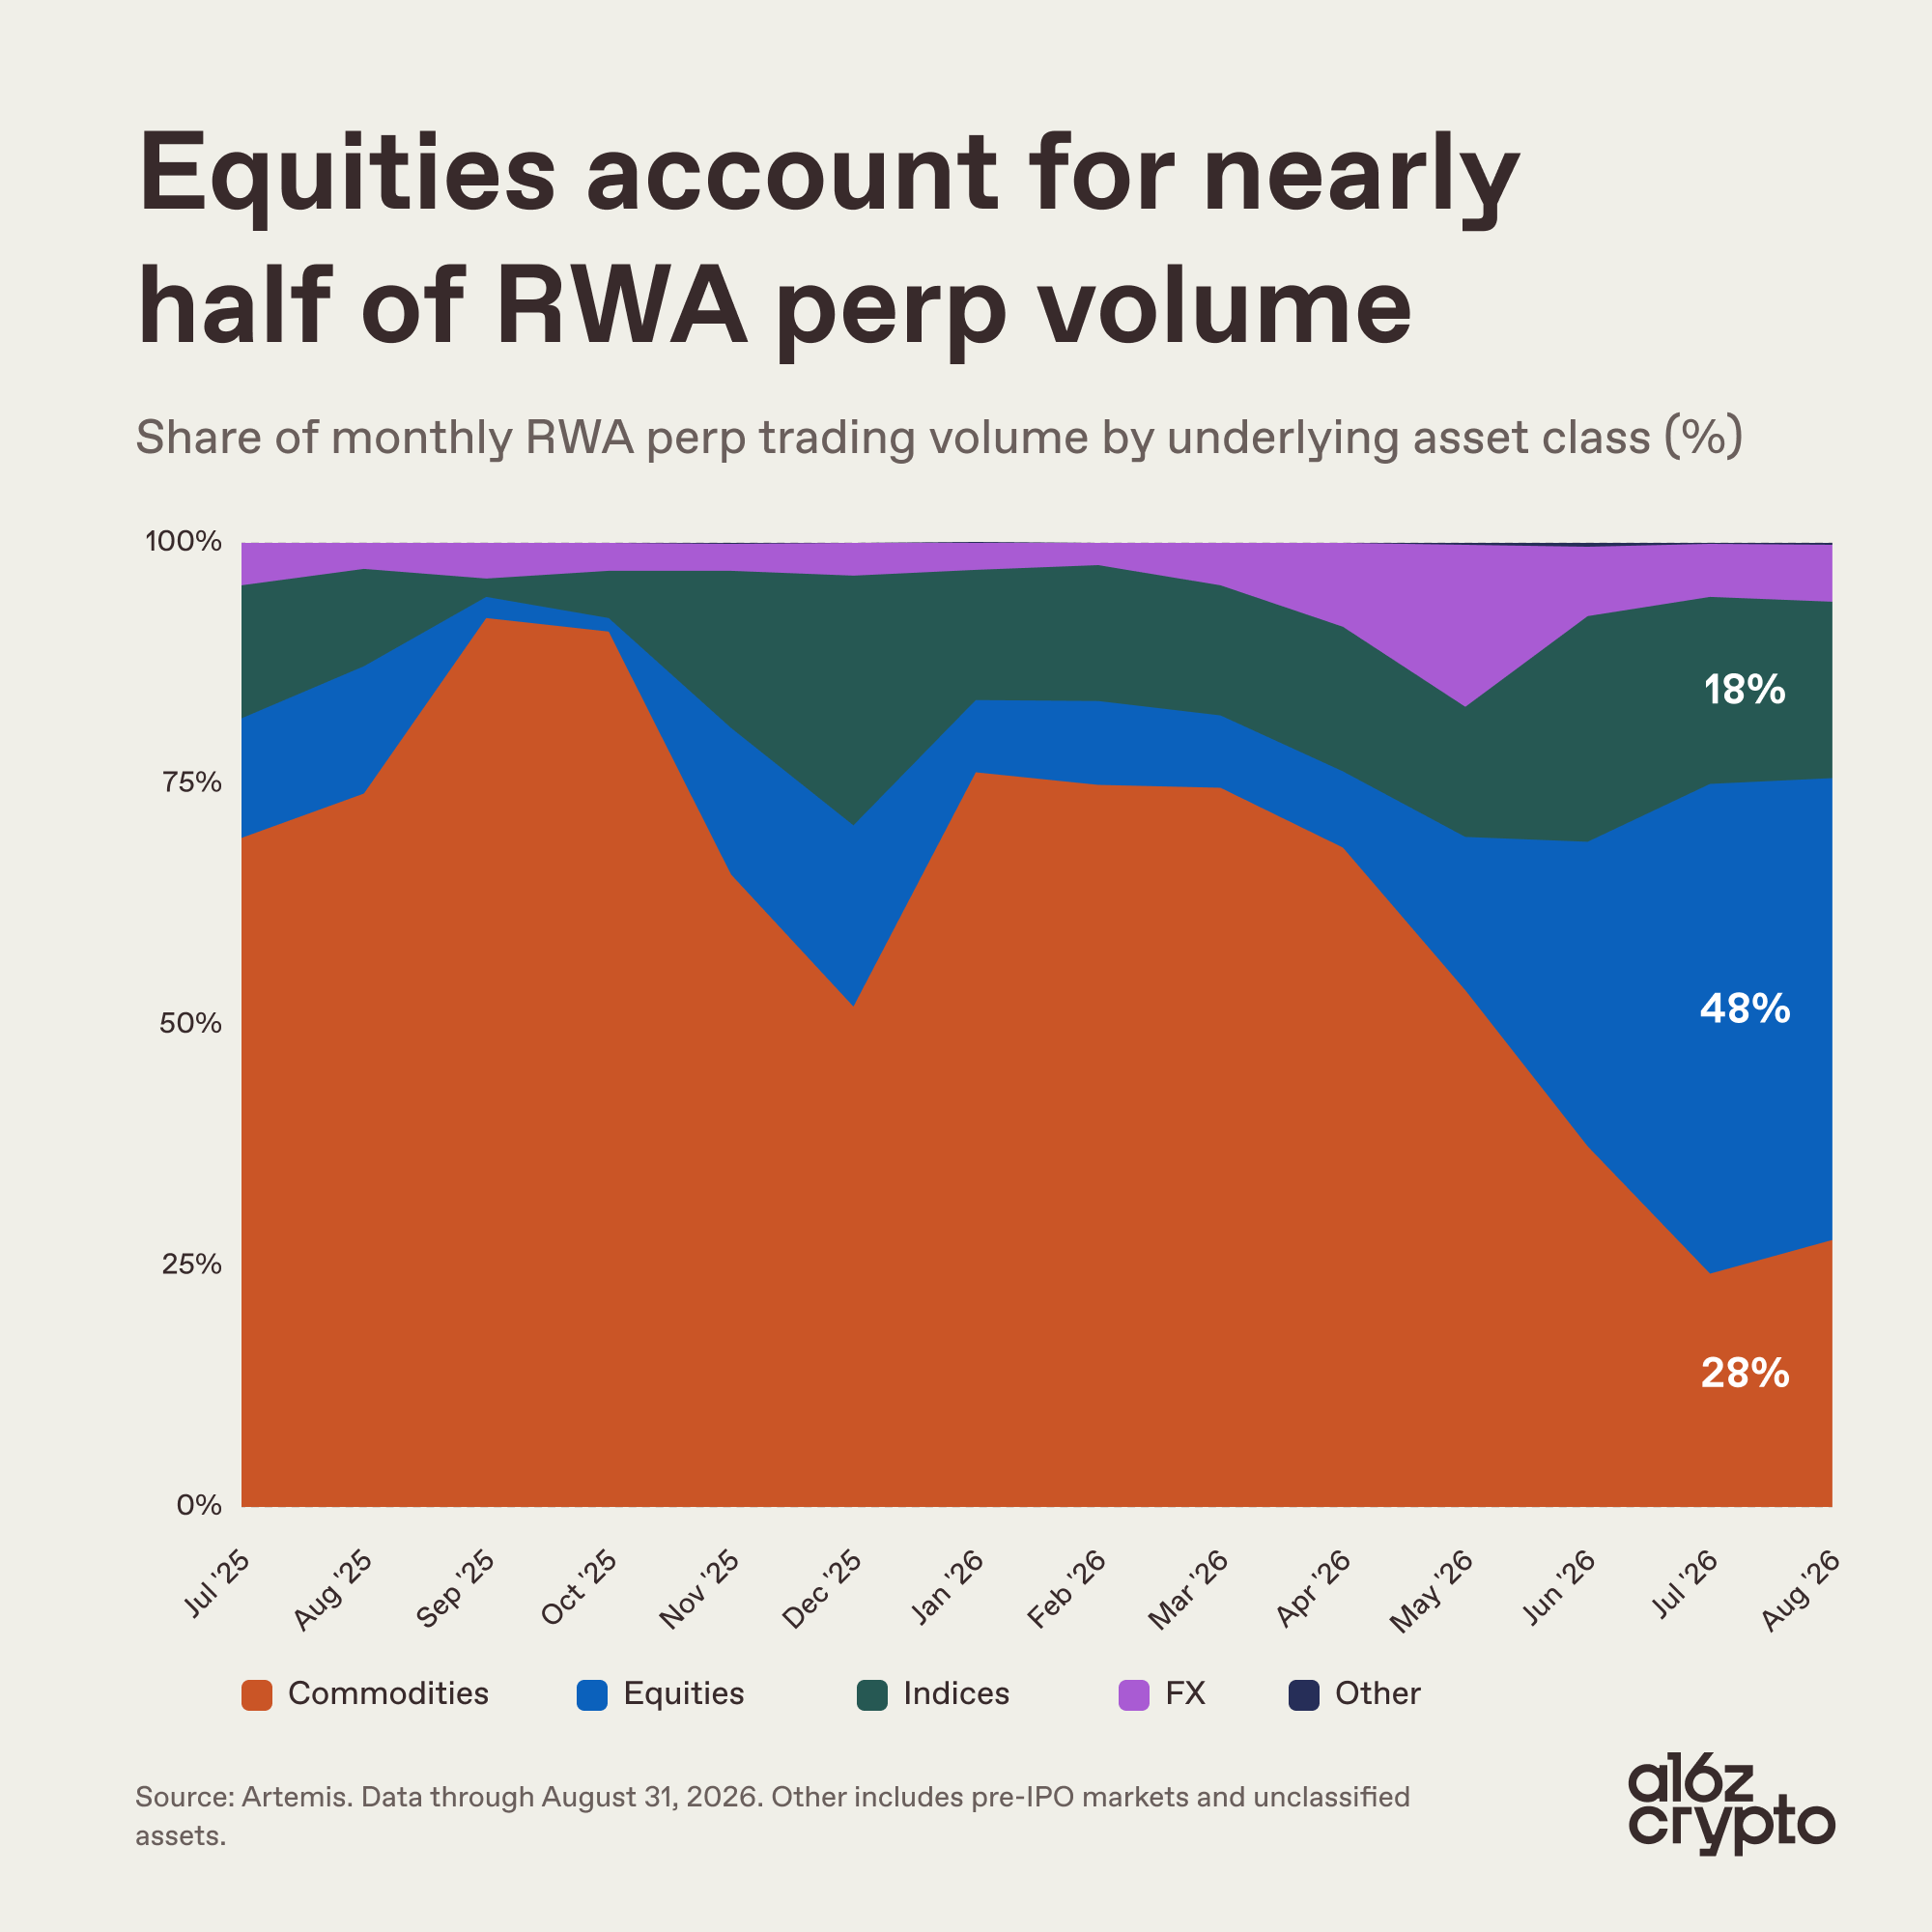
That does not necessarily mean fewer dollars were traded in gold. These figures describe shares of a market that was itself growing rapidly. The clear change is that equities now take up a much larger part of the pie.
Gold often moves in response to interest rates, the US dollar, or a broad macro shock. Stocks also have earnings reports, product launches, and news about individual companies. If an exchange can open a new pair quickly and market makers are willing to quote prices, each story can become its own market. This is a plausible explanation, not a cause proven by a16z.
Open interest, or OI, offers another clue. It measures the notional value of contracts that remain open. Volume counts trades. The same capital can change hands repeatedly, lifting volume even when few positions remain at the end of the day.
Equity OI reached $1.6B in June 2026, passing commodities at $1.2B. Equity trading volume did not pass commodities until July. By August, equity OI stood at $2.2B, versus $1.6B for commodities. In other words, traders had already built more exposure to stock prices before the monthly volume data fully reflected the shift.
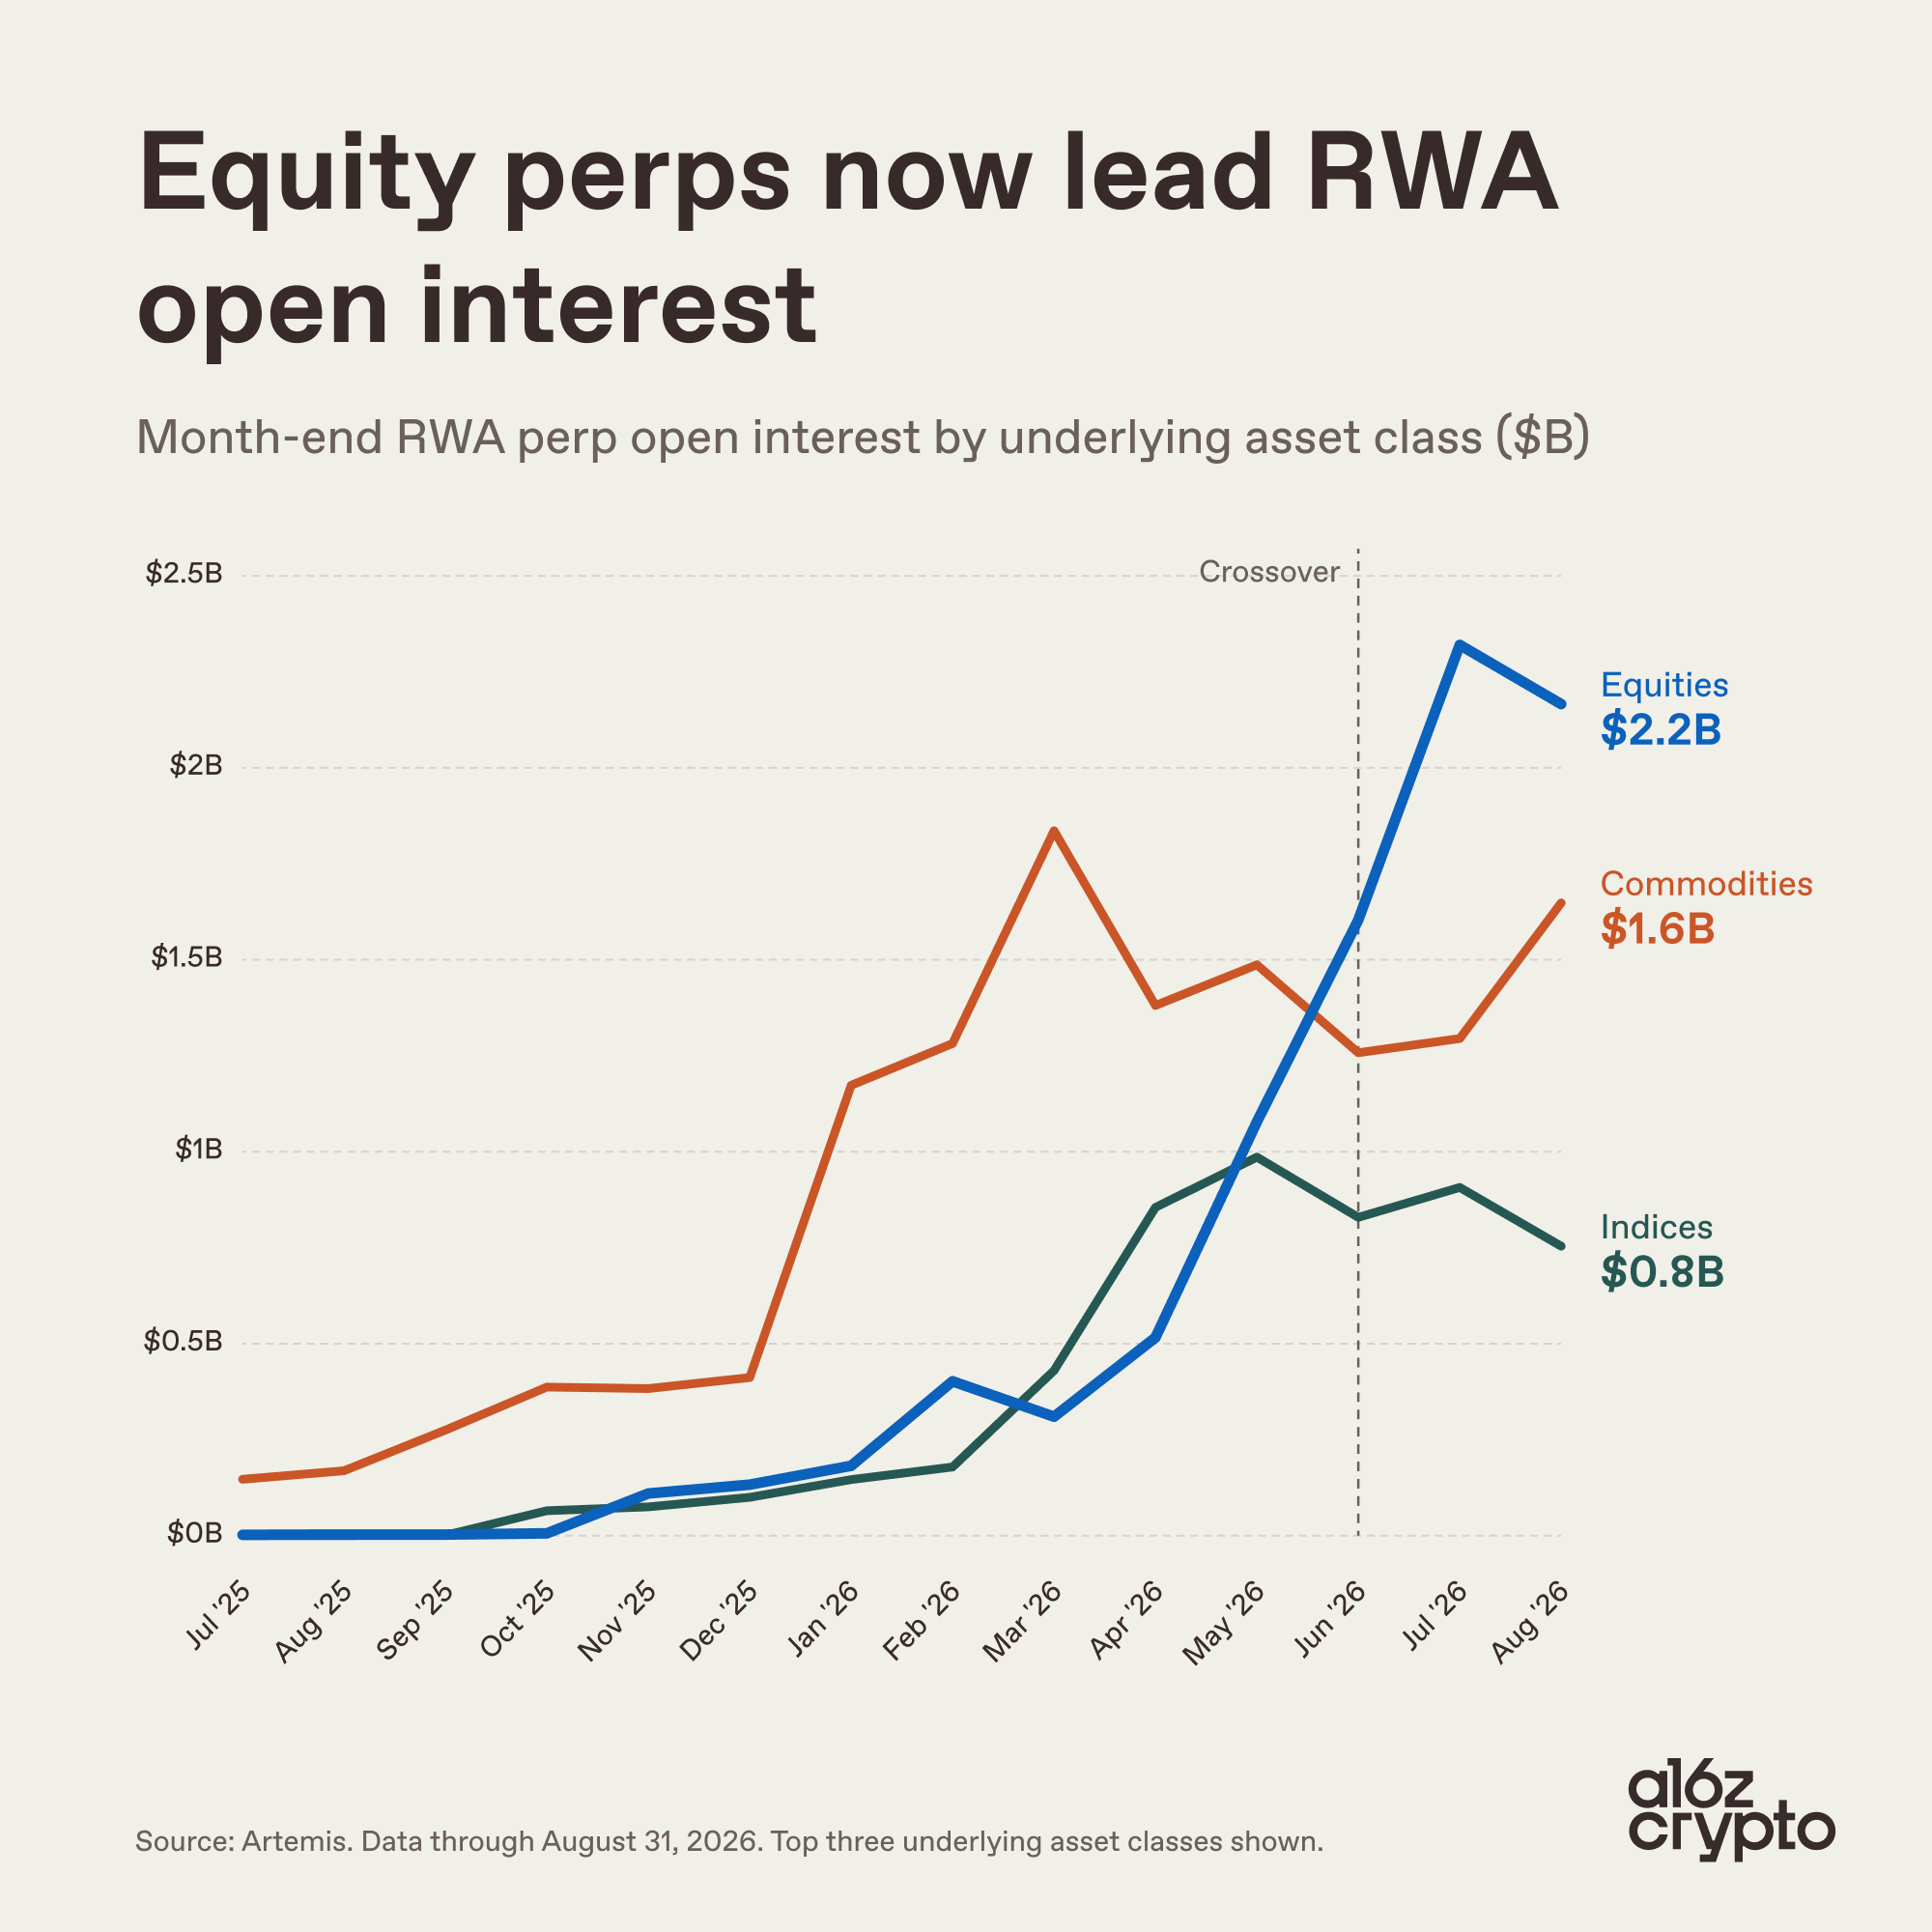
OI still cannot show which direction traders are betting, how much leverage they use, or how long they will stay. To understand that capital, each pair needs a closer look.
Have Onchain Venues Beaten Centralized Exchanges?
Reading the a16z report alone might suggest that they have. Among the venues it tracks, centralized exchanges handled roughly two-thirds of monthly RWA perp volume through November 2025. The split was close to even in December. By August 2026, onchain venues accounted for 86%, or roughly $101B, while centralized exchanges handled about $16B.
One possible reason is that launching a market became easier. Hyperliquid introduced HIP-3 in October 2025. According to Hyperliquid's documentation, builders can deploy perp markets on existing trading infrastructure and take responsibility for the contract, reference price, and leverage limits.
Previously, a trader who wanted a new pair often had to wait for an exchange to list it. HIP-3 lets builders launch a market on infrastructure that already exists. But a new listing is still hard to trade if few orders sit in the book or the price feed cannot be trusted.
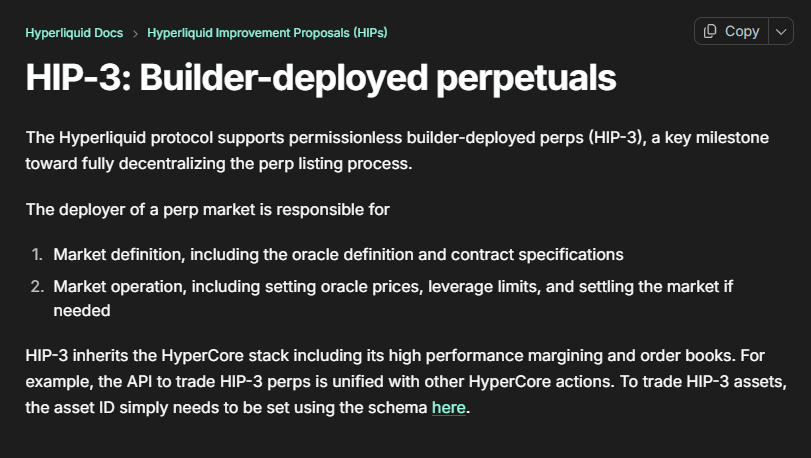
HIP-3 arrived around the same time that onchain volume began climbing, but that timing does not prove it was the only cause. It also does not establish that centralized exchanges have lost.
Pyth reports $751.9B in RWA perp volume for August 2026. Its figures include $437.4B on Binance alone and $84.6B on Hyperliquid. That total is far above a16z's $117.3B. The two sources cover and classify markets differently, and there is no complete venue-by-venue and contract-by-contract reconciliation available to put them on identical footing.
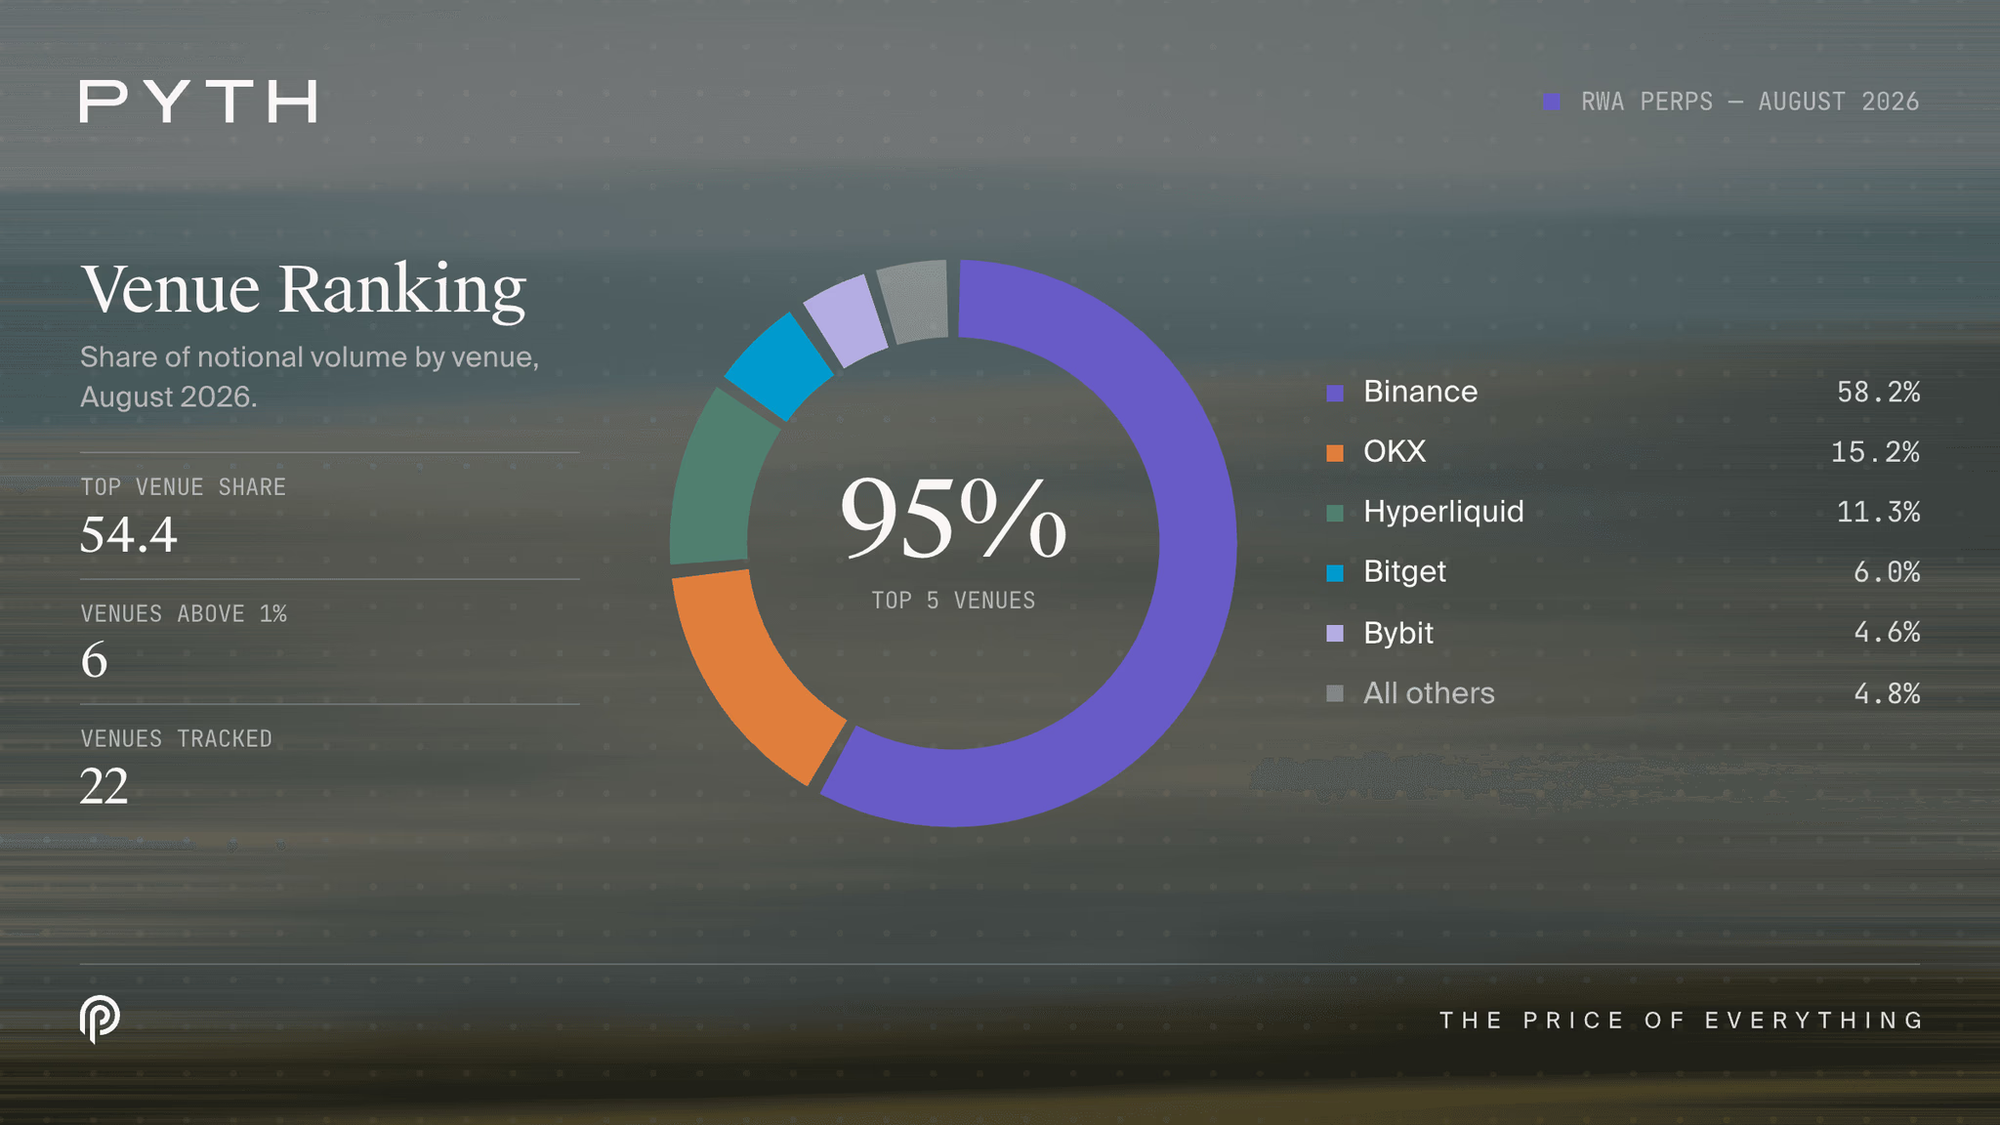
So the 86% figure describes the onchain share within a16z's dataset, not a market-wide share. Onchain activity is growing quickly in that sample, while centralized exchanges still show substantial volume in Pyth's. Whales has explored the wider race to add trading features in this analysis.
Does $117.3B in Volume Make It Easier to Enter and Exit a Trade?
Large volume sounds reassuring. At the moment of placing an order, however, a trader needs to know how much that order will move the price.
According to a16z, volume peaked at $145.1B in July 2026 before falling to $117.3B in August. Total OI, meanwhile, rose from $161M in July 2025 to $4.8B in August 2026 and remained near its peak. More exposure was still open even as monthly trading slowed, but that does not prove every pair has traders willing to hold positions for the long term.
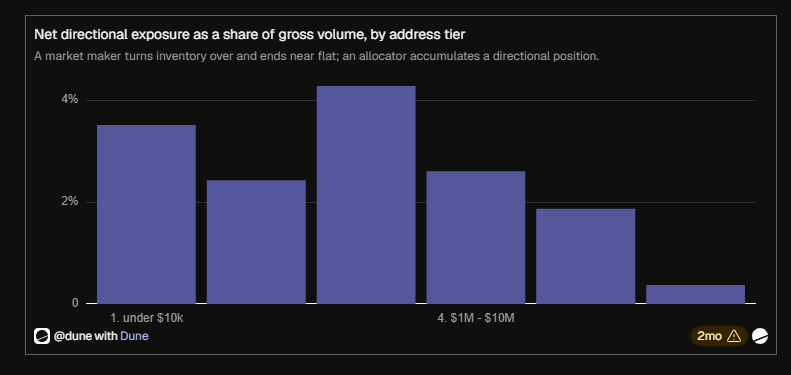
Dune examined HIP-3 trading data for July 2026 and found a telling detail. Just 105 addresses, each trading more than $100M, generated 65.2% of the volume in its sample. After $128B in gross trading, the group's net exposure at month-end was only $478M, or roughly 0.37% of that turnover. A great deal of volume can come from repeated trading and market making, rather than from an equivalent amount of capital staying in bets on stocks.
High daily volume also does not guarantee a deep order book at every moment. Dune found that the HIP-3 SK Hynix market typically had about $300,000 in sell orders within 0.10% above the mid-price during an ordinary minute. Market makers keep adding orders, so a market can trade heavily over a full day. Someone who needs to buy a large amount at once may still have to fill the rest at higher prices.
Two pairs with the same daily volume can therefore feel very different to trade. SK Hynix is one example, not a stand-in for every stock perp.
Funding is another cost. Perps have no expiry, so keeping a position open may mean making periodic payments. Dune observed positive funding across the months it studied for some HIP-3 markets, including Nvidia and gold, while the S&P 500 was closer to balanced. A position can become expensive to hold even when the directional call was right.
Whales has covered funding, liquidations, and thin liquidity in its guide to hedging with pre-market perps. Those token markets before TGE differ from RWA perps, but both show how holding costs can eat into a trade's gains.
Weekend Trading: Where Does the Price Come From When Stocks Are Closed?
This is where the promise of 24/7 trading meets its hardest question.
When the underlying stock exchange is open, the perp market has an updating stock price to compare against. On a Saturday night, a company can still release news while its shares are not trading. The perp continues to trade on expectations, and its price may differ substantially from the stock price when the exchange reopens.
Each HIP-3 market needs its builder to choose and update an oracle, or reference price feed. Hyperliquid stresses that this price should resist manipulation. Pyth raises the question of where a reliable reference price comes from when stock markets are closed. A market that stays open all week does not guarantee that its perp will closely track the underlying stock at every moment.
Trading activity is not evenly spread across the week either. In Dune's HIP-3 sample, weekend activity was just 13% of weekday activity. For comparison within the same study, Hyperliquid Core markets retained 47%. These percentages do not represent every venue, but they show the difference between being able to trade and finding enough orders on both sides of the book.
A trader carrying a position through the weekend may face a less certain reference price, fewer opposing orders, and funding that keeps running, all at once. Leverage magnifies those risks. a16z also notes that most venues restrict US persons' access to true perpetual futures, so the existence of volume does not mean these products are available in every market.
Where Is the Real Opportunity for RWA Perps?
In a16z's dataset, equities now lead RWA perp volume, while HIP-3 lets builders launch more markets. Crypto traders have gained a way to trade the price movements of traditional assets.
Still, more pairs and higher volume can coexist with costly funding and heavy slippage. Deep order books, dependable reference prices, and traders who return are what make a market useful over time.
The outcome will also depend on trading quality after the breaking news passes and while the underlying market is closed. If that quality fades, volume mainly shows that people came to try the product. If it holds up, RWA perps have a chance to become a tool traders use regularly.
FAQ
Is an RWA perp the same as a tokenized stock?
No. An RWA perp is a contract for trading price movements. It does not itself confer ownership of shares, dividends, or voting rights. A tokenized stock may have a different set of rights depending on its issuer. The terms of a specific product matter before treating its token as equivalent to an actual share.
Why does a16z report $117.3B while Pyth reports $751.9B for August 2026?
They track and classify different sets of markets. a16z reports the venues it chose to follow; Pyth includes substantial centralized exchange activity, such as Binance's. There is no shared reconciliation showing exactly which contracts account for the difference, so the two numbers should not be used as if they measured the same group of markets.
Does rising OI mean the market has enough liquidity?
No. OI is the notional value of contracts still open. It does not show the price at which a large order could fill, how much funding currently costs, or how much leverage traders use. Assessing a specific pair also means checking its order book, spread, and the cost of keeping a position open.