
When traders talk about odds in a prediction market, they are not just talking about numbers on a screen. They are looking at a live snapshot of how thousands of people, with different information and incentives, are collectively pricing the future. Unlike a typical price chart for a token, prediction market odds are designed to be read directly as probabilities.
The entire article below explores what those odds actually mean, how they are formed, how they move when information changes, and how users can use them as a tool for analysis rather than just for betting.
What is Odd on Prediction Market?
An odd in prediction markets is a market-driven probability that reflect how traders collectively price the likelihood of future events. In simple terms, odds are the probability that the market believes a given outcome will happen.
In most prediction markets today, especially platforms like Polymarket, what attracts attention is not only the question about the future but also the percentage numbers shown next to each outcome: 73%, 53%, 35%, 16%… These percentages are the odds, the way the market encodes the probability that an event may occur.
In binary prediction markets (YES/NO), odds are essentially the price of the contract. A YES contract pays a fixed $1 if the event occurs and $0 if it does not, so the contract price directly reflects the market’s implied probability. For example, a price of $0.35 implies a 35% probability; small deviations can occur due to fees, spreads or low liquidity.
In prediction markets, odds are not the forecast of a single expert or the opinion of a small group; but a mix of information, expectations, and capital from all participants. That is why odds are considered a form of market-implied probability, the implied probability from the market’s perspective.
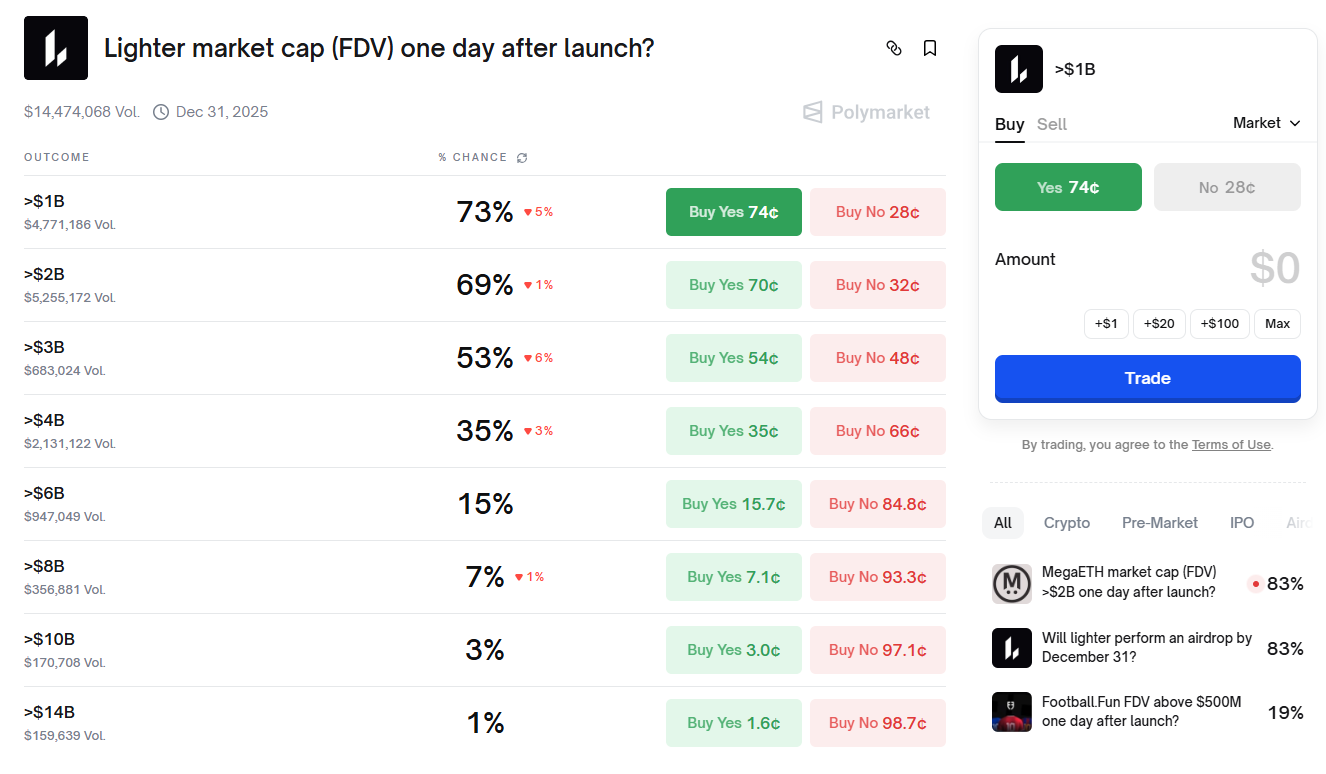
These percentage numbers are the implied probabilities that the market is assigning to each outcome. For example, with the Lighter FDV prediction case below:
- Outcome “FDV > $1B” has a 73% chance, which means the market thinks the probability is about 73%.
- Outcome “FDV > $4B” has a 35% chance, which means the market prices it at about 35%.
- Outcome “FDV > $10B” has only a 3% chance, which means the market expects a very low probability.
Read more: How to Predict on Polymarket: Complete Beginner's Guide
Why does price correspond to probability?
The mechanism of prediction markets allows price to be interpreted as a number that carries probabilistic meaning. Each trader enters the market with a personal belief about the future.
- When they believe the true probability is higher than what the current price implies, they tend to buy.
- When they believe the true probability is lower than the market price, they tend to sell.
When enough people act according to this profit-maximizing logic, the price gradually converges to an equilibrium point where no one still sees the contract as an obviously profitable bet in their subjective view. That equilibrium reflects a kind of capital-weighted average of the beliefs of all traders.
Therefore, when the market operates with sufficient liquidity and information flows relatively freely, odds can be seen as a reasonable proxy for probability.
Of course, this is not a perfect process. Trading fees, capital constraints, risk tolerance, and market sentiment can all cause odds to deviate from some abstract “true probability.”
Even so, most empirical studies like JEP, Dana… show that prediction markets often forecast better than polls or experts, as long as the market is active and the player base is diverse enough, especially for major events that attract a large number of traders:
- Presidential elections.
- World Cup finals.
- Super Bowl 2026.
Odds in Prediction Markets vs Odds of Sportsbooks
What are Odds of Sportsbooks?
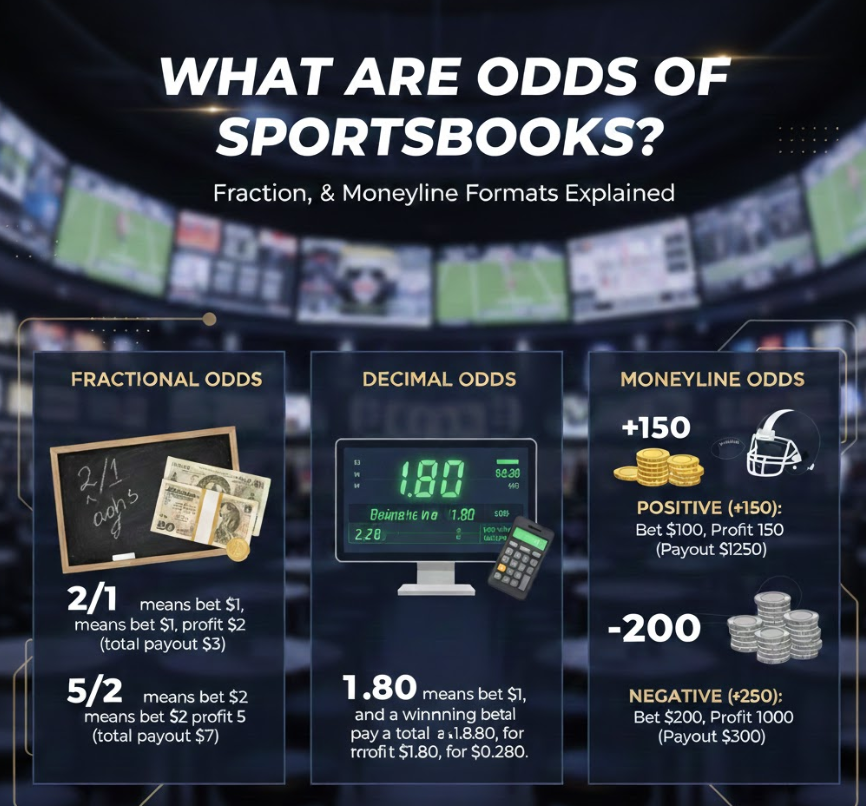
The term “odds” became popular from traditional sports betting, where bookmakers offer betting lines in three formats: fractional (2/1, 5/2…), decimal (1.8, 2.2…), or moneyline (+150, -200).
Fractional Odds: The oldest form of odds, common in the United Kingdom. Fractional odds express net profit relative to the stake. For example:
- 2/1 means bet $1 and if users win, users profit $2 (total payout $3).
- 5/2 means for every $2 staked, profit is $5 (total payout $7).
Decimal Odds: The most common form in Europe and Asia. Decimal odds express total payout when the bet wins. For example:
- 1.80 means bet $1 and a winning bet pays a total of $1.80, for a profit of $0.80.
- 2.20 means bet $1 and a winning bet pays a total of $2.20, for a profit of $1.20.
Moneyline Odds: This come in two types:
- Positive moneyline (+150): Users bet $100 and if they win, profit is $150, for a total payout of $250.
- Negative moneyline (-200): Users must bet $200 to profit $100, for a total payout of $300.
The differences
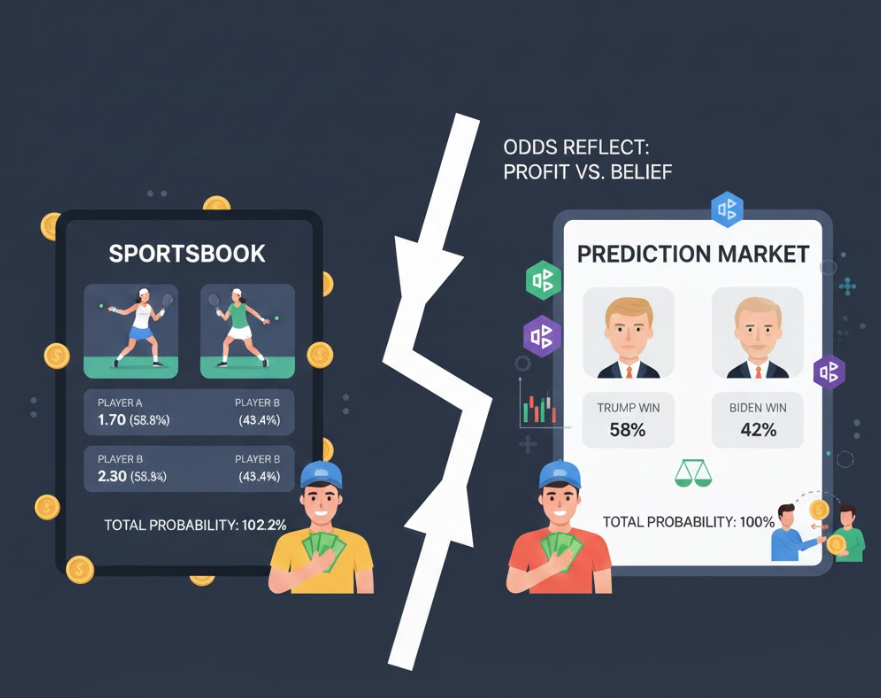
The first difference is the total percent of the outcome.
When these odds are converted to probabilities, users will notice something interesting: the total probability of all outcomes usually exceeds 100%. This is not an error but intentional, and the extra part is the bookmaker’s margin, which allows them to maintain profit regardless of which result occurs.
Example:
In a tennis match, the bookmaker offers the following odds:
- Player A: 1.70, bet $1 and a winning bet pays $1.70.
- Player B: 2.30, bet $1 and a winning bet pays $2.30.
If we convert to probability using the formula probability = 1/odds:
- Player A → about 58.8% (1/1.70)
- Player B → about 43.4% (1/2.30)
The total is 102.2%. The extra 2.2% is the overround that ensures the bookmaker wins in the long run.
In contrast, prediction markets operate under a completely different philosophy. There is no bookmaker setting odds. The price of each outcome is formed by actual supply and demand from traders via an order book or an AMM/cost-function mechanism such as LMSR. The platform can charge trading fees, but fees are not blended directly into probabilities the way sportsbooks do.
In a prediction market, if there are two outcomes A and B, then in theory: Probability of A + Probability of B is approximately 100%.
- “Trump win” is trading at 58%.
- “Biden win” is trading at 42%.
- The total is 100%.
Because this is a market that simulates a payoff of $1 if correct and $0 if wrong. In practice, there can be small deviations due to spread or liquidity, but they are usually much smaller than the margin in sportsbooks.
The second difference is in the pricing model & what it expresses.
The difference in total percent of outcome leads to another fundamental difference:
- Odds in prediction markets express the collective belief of the market. The pricing is bottom-up: traders determine odds by putting money on the line.
- Odds in sportsbooks express the bookmaker’s pricing model for profit. It can be seen as top-down pricing: the bookmaker sets the odds and players follow.
If a sportsbook is a place where users bet against the house, prediction markets resemble an exchange of beliefs where users trade directly with each other and the platform only provides liquidity and matching mechanisms.
This difference makes odds in prediction markets more reliable, better representing market expectations, and a suitable data source for analysis and forecasting.
How do odds move when information changes?
The special appeal of prediction markets lies in the fact that odds are not static but always moving. Every change in the information flow, whether large or small, affects prices. This creates a timeline of market expectations that users can observe directly.
When new information appears, traders immediately adjust their positions.
- A CPI report that is better than expected can push the odds of “the Fed will cut interest rates in Q3” from 30% to 55% within minutes.
- A negative rumor about a political candidate can push their election odds down from 48% to 35%.
- A strong tweet from Elon Musk can cause the odds of a technology-related market to surge.
Odds in prediction markets therefore react very quickly. They are faster than surveys or traditional news, reflecting in real time how the market is repricing events as traders process new information.
Importantly, odds not only reflect probability but also show the market’s level of confidence. When uncertainty is high, odds tend to fluctuate strongly in the 40–60% range. When there is near consensus, odds move close to 90–100%. When panic appears, odds can drop rapidly toward 0.
Example of actual movement:
- The outcome “FDV > $4B after launch” starts at 20%.
- News that a large fund confirms participation in the private sale pushes odds up to 32%.
- A reputable account leaks a lower-than-expected valuation, and odds drop to 18%.
- The developer confirms a more attractive tokenomics update, and odds bounce back to 35%.
By looking at the odds chart, users can see how the market “tells the story” of that event step by step.
How do odds help users make decisions?
For analysts or traders, the greatest value of prediction markets lies in their ability to turn an uncertain question into a single probability number. That number becomes a yardstick to compare market expectations with personal expectations.
For example: Imagine a new crypto project called Project X, which starts trading on a pre-market platform like Whales Market on December 1. On the first day, many traders expect the token to have its TGE within the month because the project has just announced that the testnet is complete and the roadmap clearly states “mainnet before the end of Q4.”
When a prediction market opens the market:
“Will Project X launch the token before December 31?”
The initial odds may be set around 60–65%, reflecting the market’s belief that TGE will take place in December. Positive news appears and odds increase strongly.
Suppose on December 5, the Project X team posts on Twitter that:
- The snapshot will happen “earlier than expected”.
- Audits have been completed.
- And many major exchanges interact under the tweet.
Immediately, traders increase their YES buying. Odds can jump to 80–85%, because the market believes the probability of a December TGE is now much higher. At this point, players do not have to wait until December 31 to know the outcome.
If a trader bought YES when odds were 60% and now odds are 85%, they already have a real profit if they sell their position.
The interesting thing is that prediction markets do not require users to be absolutely right. Users only need to be more accurate than the market. Profit comes from market-implied probabilities gradually adjusting toward a fair probability that users estimate better than the crowd.
Conclusion
In summary, odds in prediction markets are the way the market converts traders’ expectations and capital into implied probabilities for each future event.
There is no top-down imposition from a bookmaker and no hidden profit margin, only the market’s belief expressed as a single number that constantly adjusts as new information arrives.
Odds are not always correct, but they are the best guess of the group of traders at a given moment, something that very few traditional forecasting models can produce in real time.
FAQs
Q1.What makes prediction market odds different from regular price movements?
Odds are structured to represent probabilities directly, so every price change reflects an updated assessment of how likely an event is. Unlike token charts driven by speculation, odds map directly to expected outcomes.
Q2.Can prediction market odds be manipulated?
Short-term fluctuations can be influenced by low liquidity or coordinated buying, but sustained manipulation is difficult because informed traders will arbitrage mispriced outcomes until odds return to a rational level.
Q3.Are prediction markets accurate in forecasting real-world events?
Their accuracy improves when liquidity is high and participants are diverse. Historical studies show prediction markets often outperform polls and expert opinions in political, economic, and sports forecasting.
Q4.Do users need the event to resolve in order to profit?
No. Traders can take profit early by selling positions when odds move in their favor. Prediction markets price expectations continuously, allowing gains long before the final outcome.
Q5.Is it possible for odds to reach 100% or 0% before an event happens?
It can happen when the market believes the outcome is effectively certain, usually after decisive information appears. However, odds rarely hit a perfect 100% or 0% until official confirmation is released.