
In the crypto market, market cap is commonly used to evaluate the size and relative expensiveness of a project. However, with complex tokenomics and vesting mechanisms, FDV (fully diluted valuation) has become increasingly important in long term analysis.
Many projects have a low Market Cap but a very high FDV, leading investors to believe they are buying early, while in reality the project has already been valued at a high level from the beginning.
So what is FDV, how is it different from Market Cap, and why can misunderstanding FDV lead to poor investment decisions?
What is Fully Diluted Valuation (FDV) in crypto?
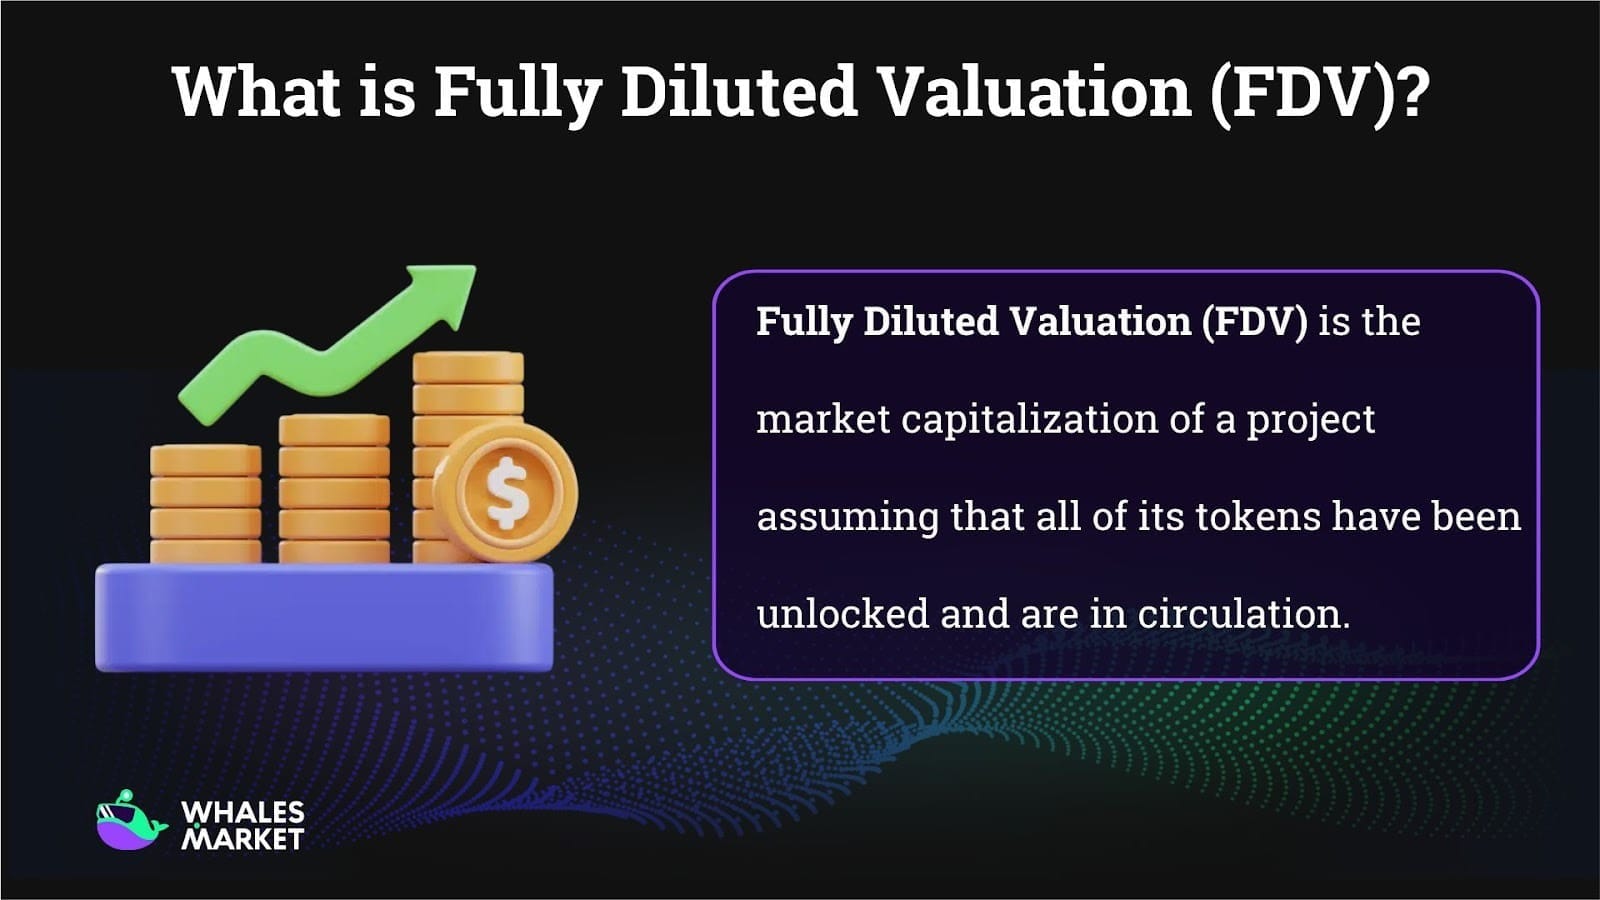
Fully Diluted Valuation (FDV) is the market capitalization of a project assuming that all tokens have been unlocked and are circulating in the market. In other words, FDV reflects the “maximum” valuation of a project in the scenario where no tokens remain locked or unissued.
Meanwhile, the Market Cap of a project only accounts for the number of tokens that are actually in circulation. This difference is particularly important in crypto, where a large portion of tokens are often locked for many years for the team, early investors, and ecosystem development funds.
How to calculate FDV in the Crypto Market
FDV (Fully Diluted Valuation) can be calculated based on the assumption that the maximum token supply of a project has already been issued and is circulating in the market at the current price. The formula for calculating FDV of a project is straightforward:
- FDV = Current token price × Maximum supply
However, in most cases, not all tokens are circulating at the current time. Instead, only a portion of the tokens have been issued and are trading in the market. In that case, Market Cap is calculated based on the circulating supply of a project, using the formula:
- Market Cap = Current token price × Circulating supply
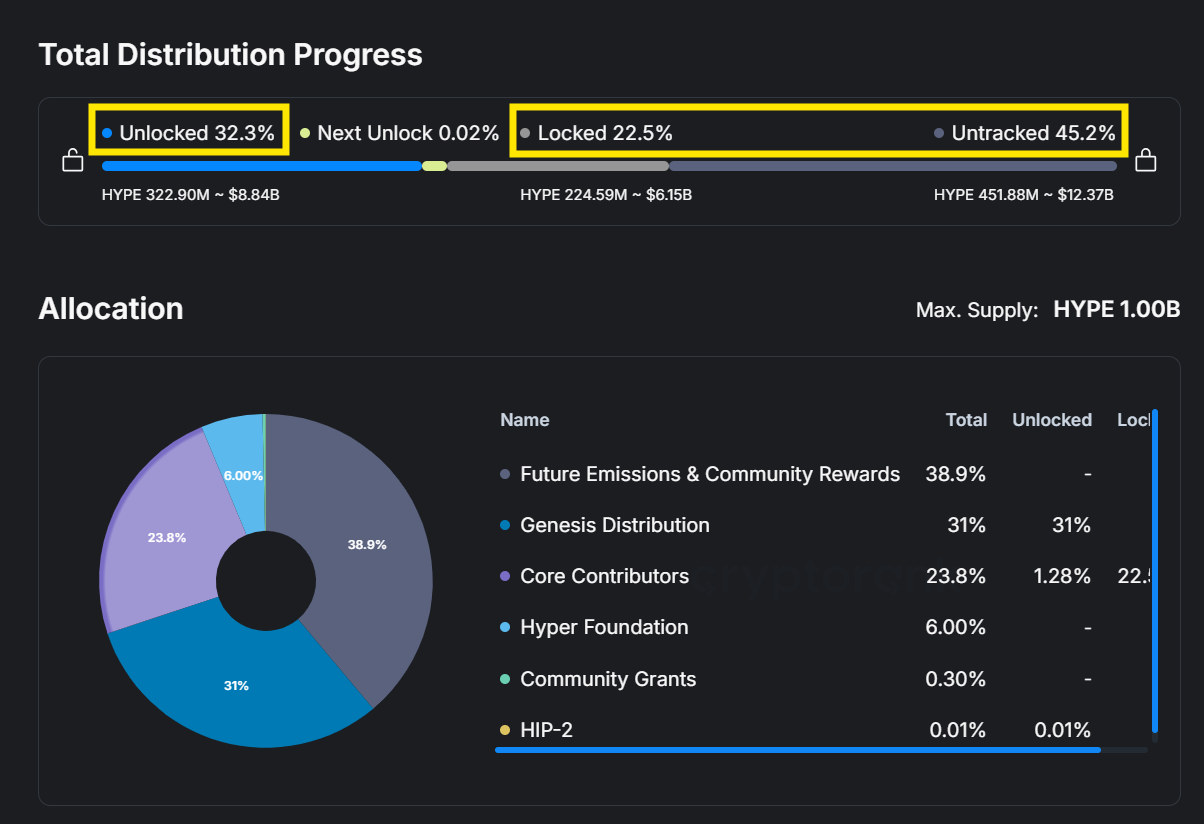
Example: Hyperliquid (HYPE), as of 28/1/2026, the market price of HYPE is $27.25 and the maximum supply of the project is 1,000,000,000 tokens. The FDV of Hyperliquid is calculated as:
FDV = 27.25 × 1,000,000,000 = $27.25B
Meanwhile, the circulating supply is only about 238,385,315 HYPE, so the current Market Cap is:
Market Cap = 27.25 × 238,385,315 ≈ $6.49B
The large gap between Market Cap and FDV shows that most of the HYPE supply has not yet been issued. This means that in the future, when the remaining tokens are unlocked and enter the market, dilution pressure and selling pressure may affect the token price.
Advantages of understanding FDV in the crypto market
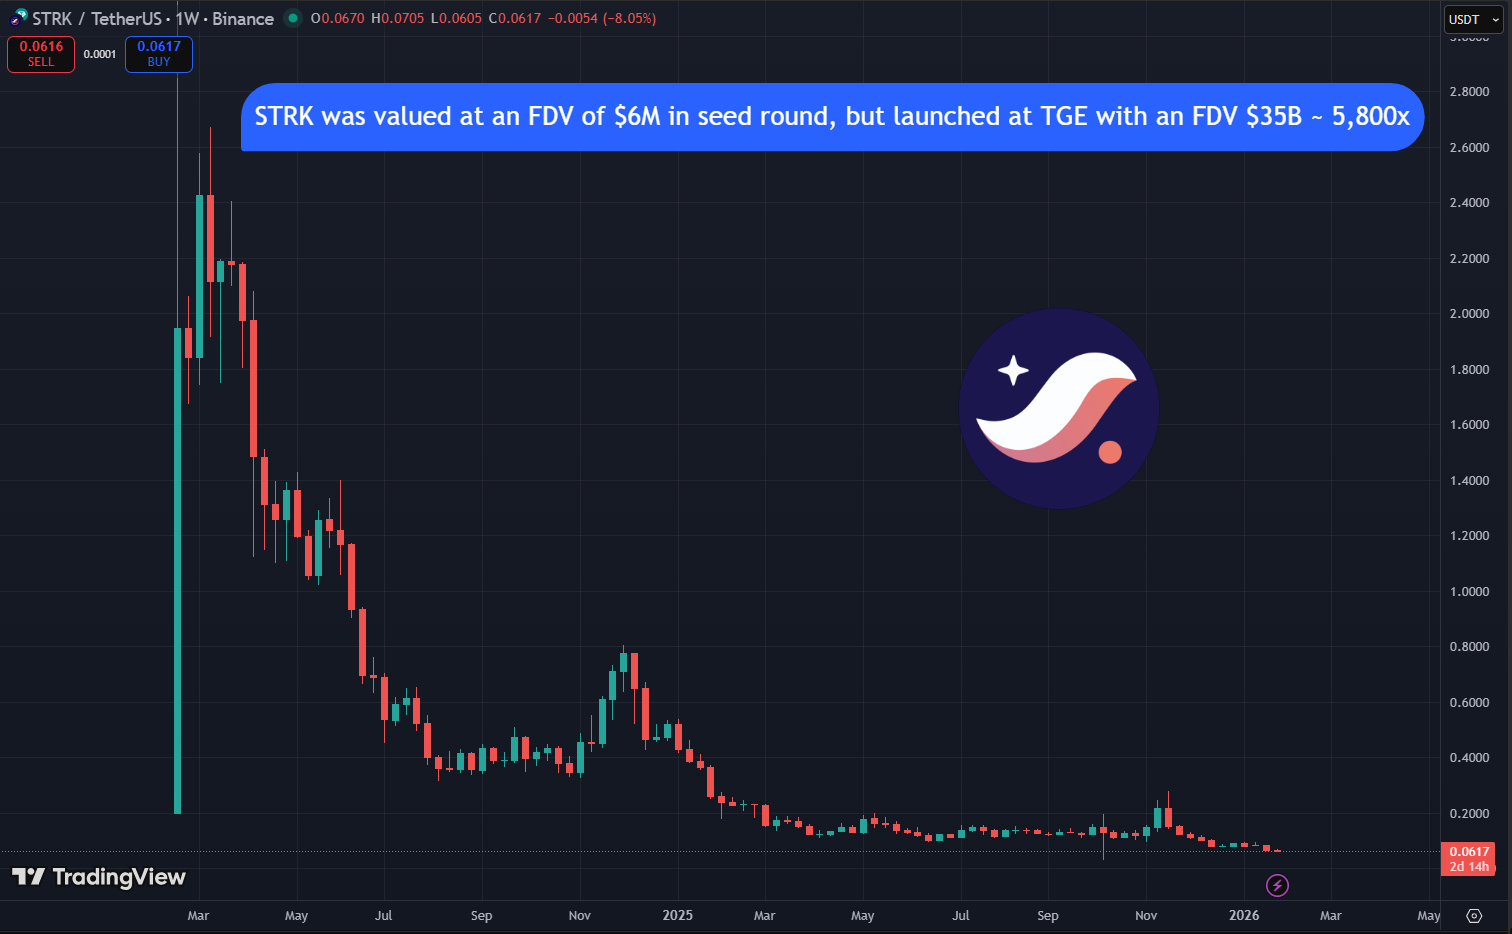
Before listing, projects typically go through multiple funding rounds such as seed, private, or strategic, with each round associated with a valuation. That valuation represents the FDV at the time the investment fund participates.
FDV is not only a valuation number, but also a basis for assessing potential returns, token selling behavior, and future supply pressure, with different implications for retail investors and venture capital funds.
For retail investors
For investors in the secondary market, Market Cap reflects the current size of a project based on the circulating supply.
Meanwhile, FDV allows investors to look further ahead at the maximum value of the tokens held by each party when all tokens are unlocked. By combining FDV with tokenomics, investors can estimate the potential profits of the team, investment funds, and early investors, thereby evaluating the attractiveness of the project and its dilution risk.
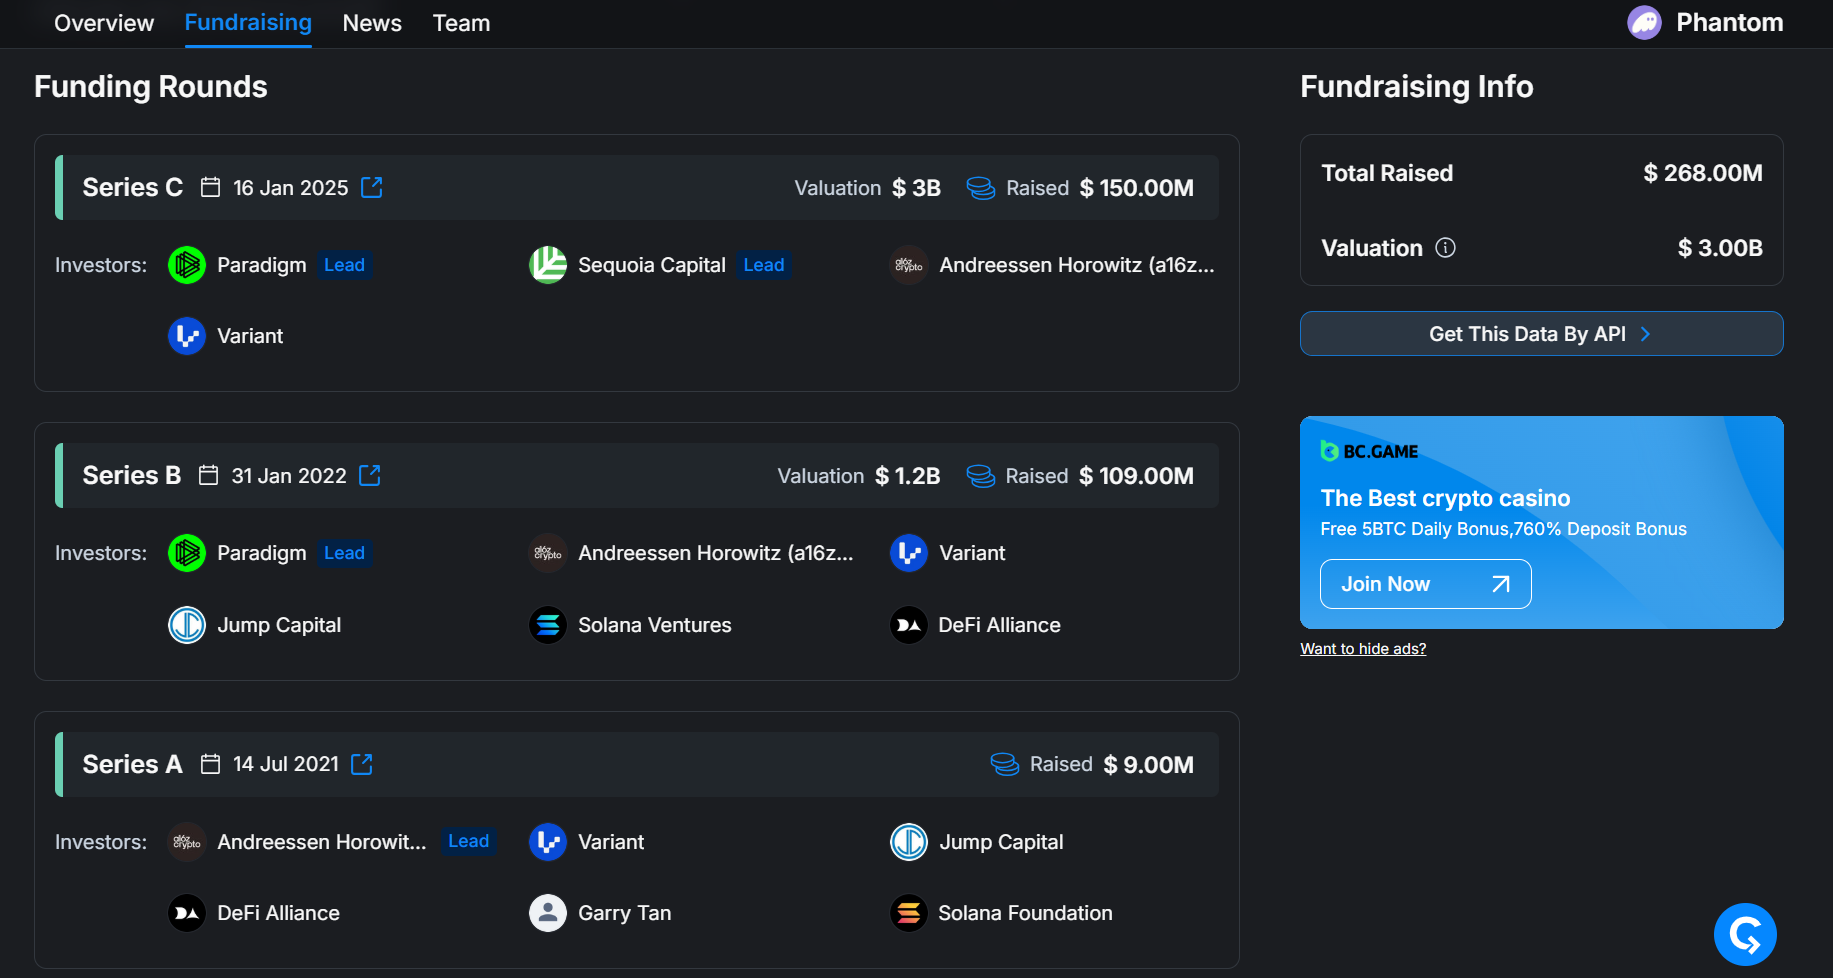
Example: Phantom raised capital across multiple rounds with increasing FDV valuations as follows:
- Series A (07/2021): Raised $9M, FDV not officially disclosed, estimated at several hundred million USD.
- Series B (01/2022): Raised $109M at a valuation of $1.2B FDV.
- Series C (01/2025): Raised $150M at a valuation of $3B FDV.
Assuming Phantom issues a token and lists on the market at a valuation of approximately $3B FDV, equivalent to the Series C round, the theoretical returns for each investment round would be:
- Series A: approximately x10 to x15, depending on the actual initial valuation.
- Series B: approximately x2.5, from $1.2B to $3B.
- Series C: approximately x1, near breakeven at the listing FDV.
However, in practice, investors cannot sell all tokens immediately at listing. Tokens are usually unlocked in multiple tranches over a long period. The actual realized profit of each group depends directly on the FDV at the time unlocking begins and on price movements throughout the vesting process.
At this point, FDV becomes a particularly important tool for secondary market investors. It allows investors to estimate:
- The valuation level at which funds and teams are holding their tokens.
- How many times they are in profit relative to their initial capital when unlocking begins.
- Whether their selling incentives are strong or weak at the current valuation.
If, at the time unlocking begins, the market FDV is many times higher than the FDV of the initial investment rounds, the likelihood that funds will realize profits early is very high, creating selling pressure.
Conversely, if the market FDV is only slightly higher or even lower than the FDV of previous rounds, selling incentives will be weaker and the risk of heavy dumping will be reduced.
For VCs (Venture Capital)
For venture capital funds, FDV is often used as a reference point, but it does not represent the actual realized return of an investment. In practice, VC returns depend on how tokens are unlocked and sold over time, not on the headline FDV at any single moment.
To illustrate this, consider the following example.
Assume a VC invests in a project at a valuation of $400M FDV. The fund’s tokens are unlocked gradually over a 10-month vesting schedule, with 10% released each month.
- In the first month, the VC sells 10% of its tokens at a valuation of $1B FDV.
- In the second month, another 10% is sold at a valuation of $2B FDV.
- In the third month, the market corrects sharply, and the VC sells the next 10% at a valuation of only $200M FDV.
- This process continues until the final month, when the remaining 10% is sold at a valuation of $400M FDV.
In this scenario, the fund’s actual return is not determined by any single FDV, whether at listing or at peak prices. Instead, it depends on the total value realized across all token sales during the entire unlocking period.
The final return multiple is therefore calculated as the total proceeds from all sales divided by the initial investment, rather than by referencing a single headline FDV figure.
From a VC perspective, risk does not only come from price volatility during the unlocking phase, but also from non-financial factors. Funds may face reputational risk if a project fails, or be forced to wait a very long time before a token is launched and vesting even begins.
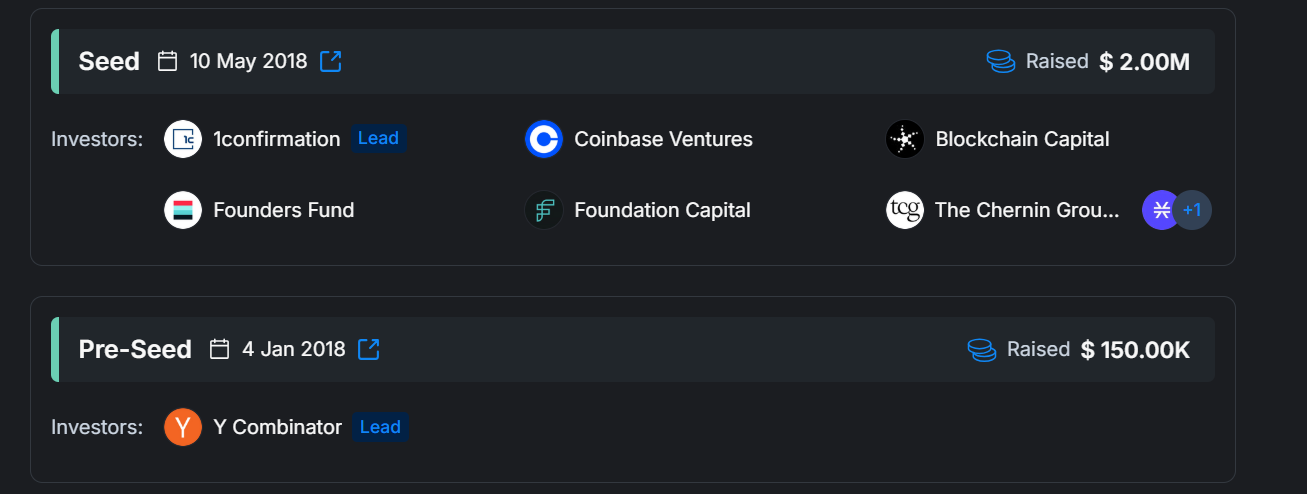
The case of OpenSea is a typical example. Seed round investors participated in 2018, but by 2026, the project has still not conducted a TGE. During this entire period, capital remained locked and unrealized.
What does the FDV / Market Cap ratio indicate?
The FDV / Market Cap ratio reflects the gap between a project’s maximum valuation and its current market capitalization. In other words, it indicates the percentage of supply that has already been issued and the remaining dilution potential.
When the FDV / Market Cap ratio is high, it shows that most tokens have not yet entered the market. In the future, as these tokens are unlocked, increasing supply may create selling pressure on the token price.
Conversely, when FDV is only moderately higher than Market Cap, it indicates that most tokens have already been issued, dilution risk is lower, and the supply structure is more stable. Such projects are generally more suitable for medium to long term holding strategies.
In practice, the FDV / Market Cap ratio is often used as a quick screening indicator:
- A low ratio suggests low dilution risk and relatively stable supply.
- A high ratio suggests that most tokens are still locked and significant selling pressure may appear in the future.
Is a high FDV always bad?
A high FDV does not necessarily mean a project is bad, but a high FDV always comes with very high market expectations. The issue is not the absolute FDV number, but whether that valuation matches the project’s ability to create value.
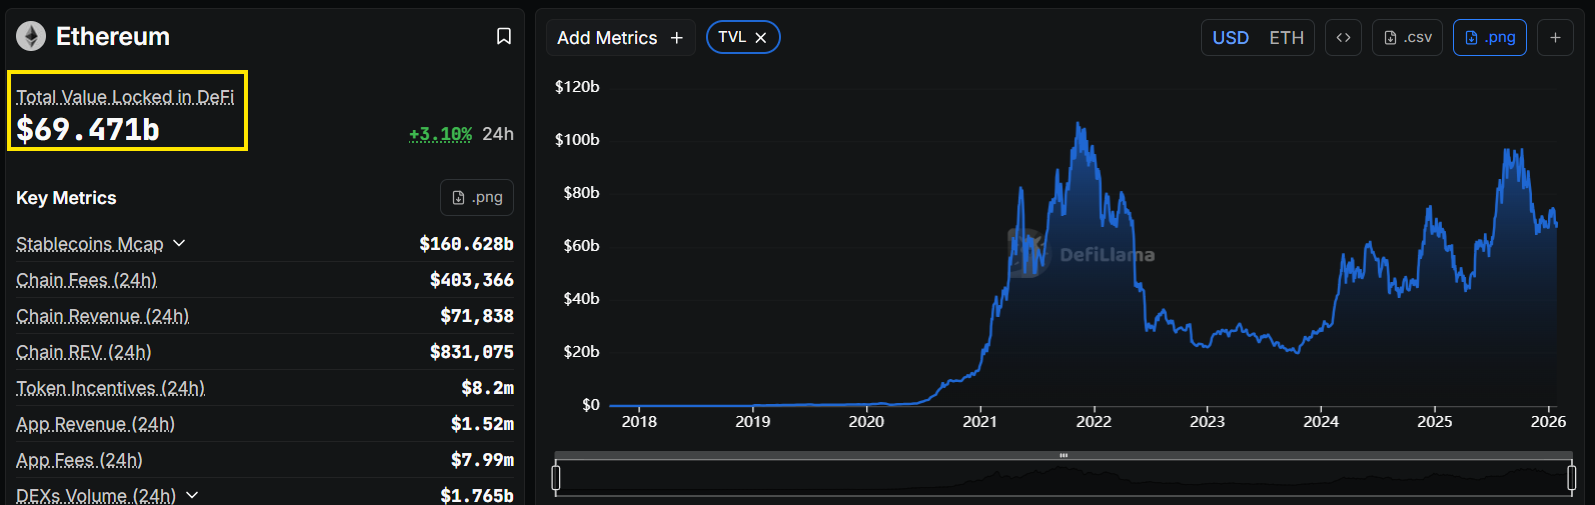
For major infrastructure projects, base layer blockchains, or protocols with core roles in the ecosystem, a high FDV may reflect genuine long term potential.
In such cases, the market is willing to pay a premium for future growth, and a high FDV can be justified if the project continues to expand users, revenue, and ecosystem activity.
Example: Ethereum is valued at around $350B, with its role as a leading platform for smart contracts and a massive ecosystem of DeFi, RWA, and EVM applications.
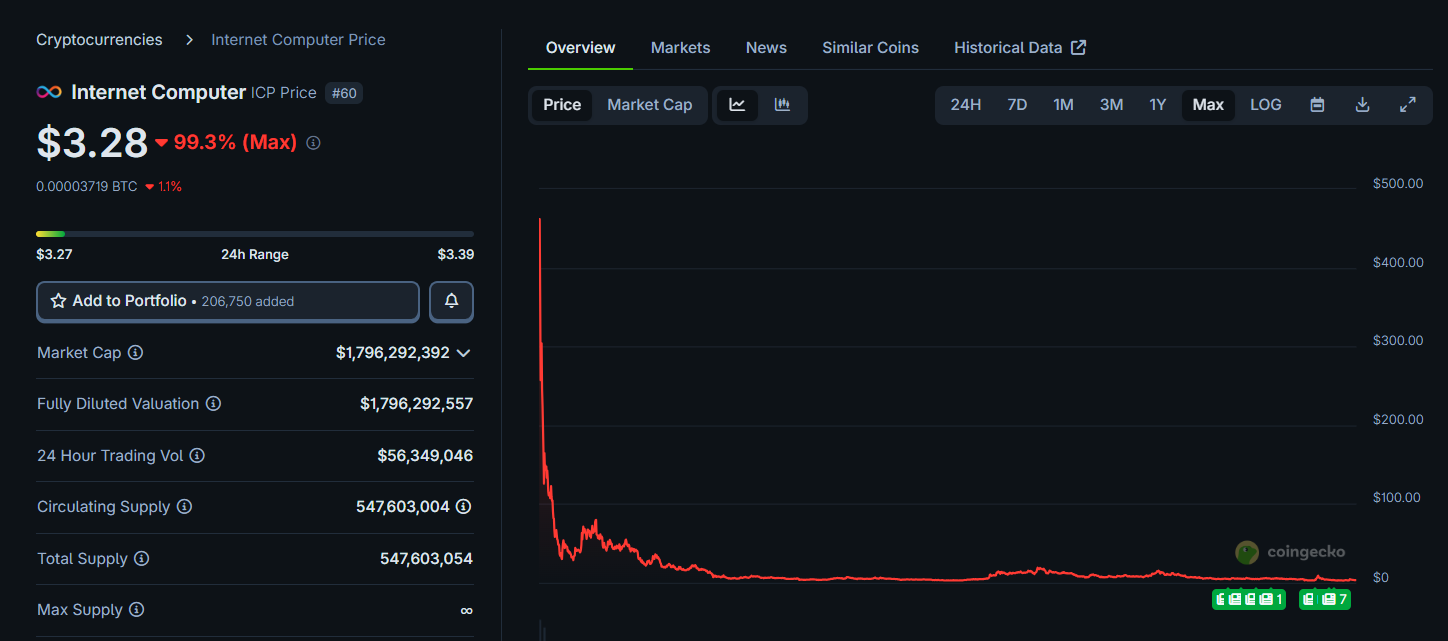
By contrast, for most newly launched projects, a high FDV is often a warning sign. When a project is still in an early stage but already valued at tens of billions of dollars, the realistic upside may be limited, while the risk of future price correction is very high.
Example: Internet Computer (ICP) listed in 2021 at a price around $700-$750, pushing FDV close to $400B due to hype around the “internet computer” model. However, due to lack of adoption and technical issues, ICP fell more than 99% to around $3. The current FDV is only about $1.8B with a total supply of over 547M ICP.
Another important point is that a high FDV reduces long term return potential for secondary market investors. When a project is already highly valued at launch, sustaining further price growth requires creating enormous new value in a short time, which very few projects can achieve.
Therefore, a high FDV is not always bad, but a high FDV in a project that has not yet proven its value creation capability is a major valuation risk to watch closely.
Common misunderstandings about FDV
One of the most common misunderstandings is treating FDV as a “target valuation” that a project will surely reach in the future.
- In reality, FDV is not a forecast, but simply a valuation assumption at the current price. When supply increases, prices rarely stay the same, let alone rise in line with FDV.
- Many investors also ignore the time dimension of FDV. Two projects with the same FDV but very different unlocking schedules carry completely different risks. A project that unlocks in 6 months faces far greater selling pressure than one that unlocks over 5 to 7 years, even if their current FDV is identical.
Finally, a common mistake is looking at FDV without analyzing tokenomics. FDV only has real meaning when placed in the context of token allocation, vesting schedules, and ownership structure. Separating FDV from tokenomics often leads to incorrect conclusions about risk and potential.
Conclusion
FDV helps investors understand dilution risk and the behavior of large token holders. Combined with tokenomics and unlocking schedules, FDV reveals whether a project is truly undervalued or only appears “cheap”, as well as the potential selling pressure in the future.
Understanding FDV correctly helps investors avoid valuation traps and build appropriate investment strategies.
FAQs
Q1. What does FDV represent in crypto valuation?
FDV represents the total market value of a token if all possible tokens were already issued and circulating at the current price.
Q2. Why is FDV important for long term crypto investors?
FDV helps investors assess future dilution risk and understand how much supply may enter the market over time.
Q3. How does FDV affect token price performance?
A high FDV often limits long term upside and increases the risk of selling pressure when locked tokens are released.
Q4. Can two projects with the same FDV have different risk levels?
Yes. Unlock schedules, token distribution, and ownership structure can create very different dilution and selling risks.
Q5. Does a low FDV guarantee good returns?
No. Low FDV reduces valuation risk but does not guarantee adoption, product success, or long term price growth.