

Bitcoin began November under immense pressure, reeling from its bad October performance. The cryptocurrency's 3.69% drop last month not only snapped a remarkable seven-year "Uptober" streak but also signaled a crucial shift in momentum.
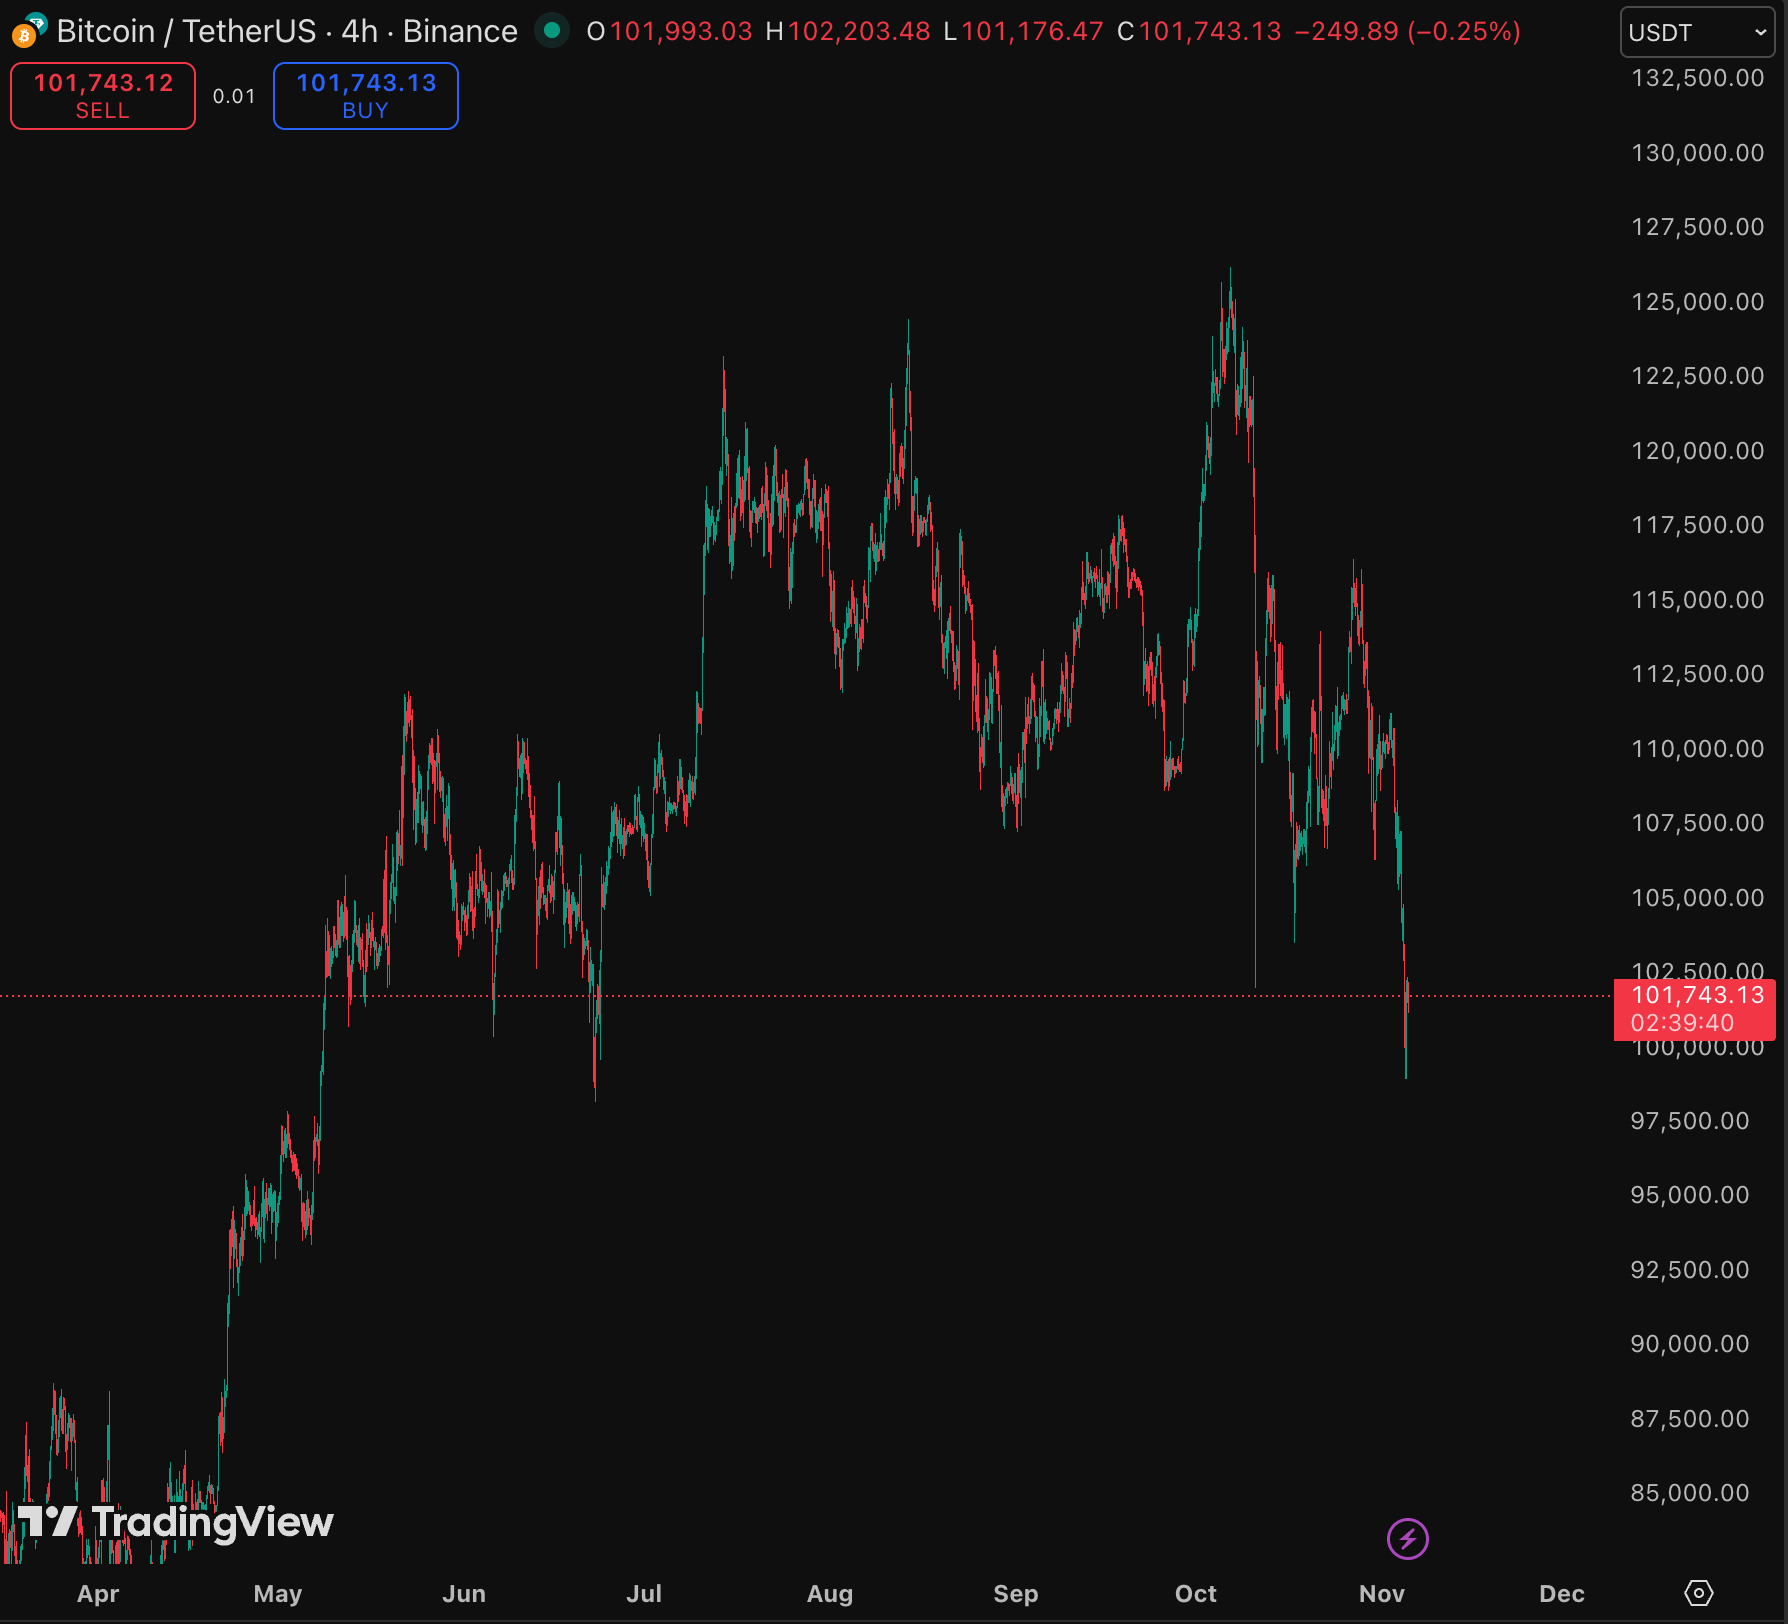
The situation escalated dramatically today, when Bitcoin price dropped below the critical $100,000 mark, instantly triggering a bear market sentiment.
The burning questions now are clear: Why is Bitcoin price going down, and what is the new floor for the king of crypto?
Bitcoin fell below $100K. Why?
On November 5th, Bitcoin slipped below $100,000 for the first time since June, representing a 20% correction from its all-time high, $126,272. The sharp downturn has wiped out over $1B in total crypto market capitalization and left over 339,448 traders liquidated in 24 hours.
So why did Bitcoin price go down?
In theory, the ongoing market volatility and downward price action are being driven by several interconnected factors:
- Federal Reserve uncertainty halts risk appetite: Although the rate cut was positive, it was overshadowed by Chair Powell’s cautious tone, which dampened expectations for further cuts in December (probability dropped from 96% to under 70%). This created strong headwinds for risk assets, leading to widespread risk-off sentiment in the crypto market.
- Persistent Macro Jitters: Underlying macro concerns, including the risk of a US government shutdown and the lingering impact of the October 10 liquidation event ($20B+ in losses), continue to drain liquidity. This toxic combination means investors are broadly avoiding risk assets until clear policy direction or market stability returns.
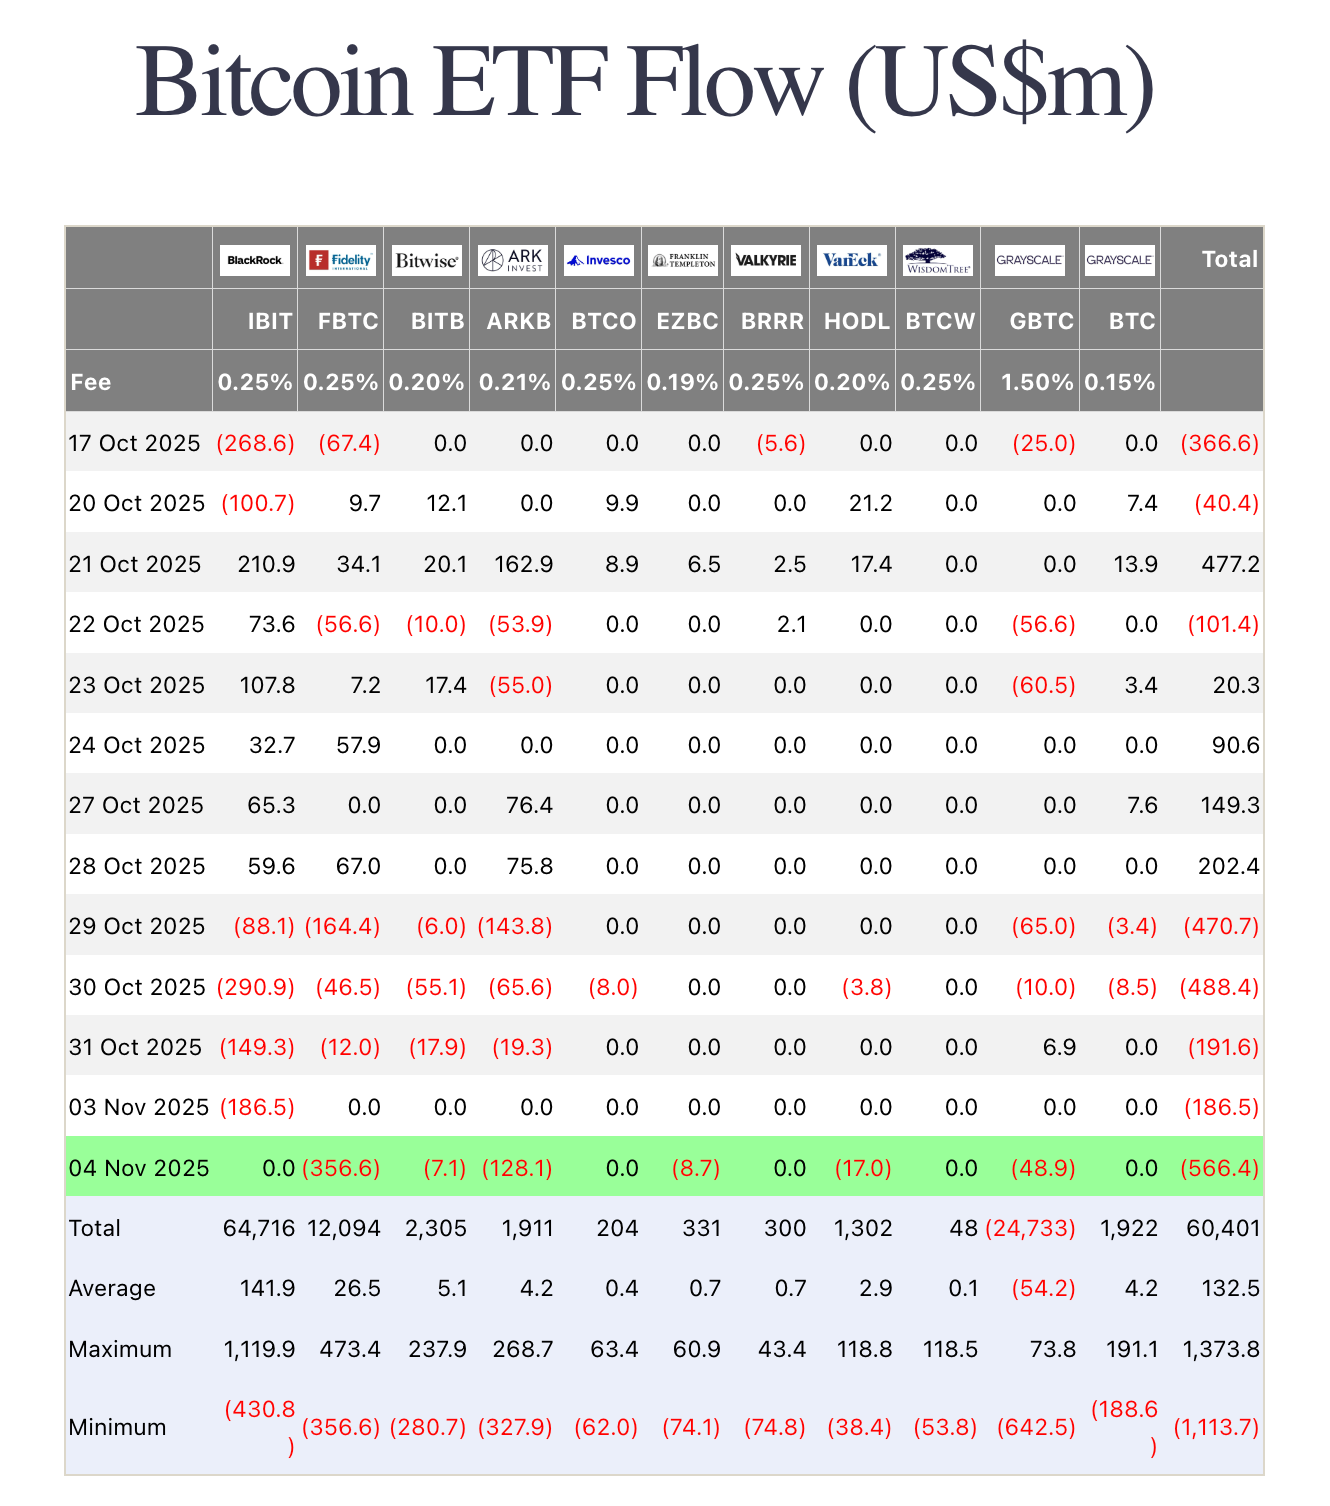
- Massive institutional and ETF outflows: The Fed's message triggered significant institutional selling. Bitcoin ETFs saw massive outflows in a day, totaling over $566M recently, marking the largest withdrawal since May 2025. Consequently, institutional demand for Bitcoin fell below the daily mined supply, removing a crucial source of market support.
- Selling by long-term holders and OGs: On-chain data from Lookonchain revealed that major sellers included both ETF investors and Bitcoin's long-term holders. Over $1.5B from legacy wallets were sent to exchanges, demonstrating that even strong hands were capitulating, adding substantial sell-side pressure to the market.
Bitcoin OGs are dumping $BTC!
— Lookonchain (@lookonchain) November 3, 2025
BitcoinOG(1011short) has deposited ~13K $BTC($1.48B) to Kraken, Binance, Coinbase, and Hyperliquid since Oct 1.
Owen Gunden has deposited 3,265 $BTC($364.5M) to Kraken since Oct 21.https://t.co/qyZllJWfFShttps://t.co/u3b8zn5iYe pic.twitter.com/qQe3dYlnfp
- Critical technical support failure: Bitcoin is battling to hold the psychological $100,000 support level after decisively breaking below its major moving averages. Technical indicators are firmly bearish, suggesting that failure to hold $100,000 could open the path to the next downside target zone around $92,000-$94,000.
- Derivatives market deleveraging: The selling pressure was amplified by the derivatives market, which saw over $1B in leveraged long positions liquidated in just 24 hours. Open interest fell, and negative funding rates confirmed a broad bearish shift, accelerating the price drop as traders rushed to unwind leveraged bets.
- Erosion of the four-year-cycle narrative: Sentiment around Bitcoin’s four-year cycle and year-end seasonality can amplify moves. As the post-halving “euphoria” window failed to materialize on schedule, investors grew impatient and rotated risk lower.
- Year-end psychology: Into November & December, funds often rebalance, harvest losses, de-risk ahead of holidays and new-year positioning. That combination can thin liquidity, magnify negative headlines, and turn routine pullbacks into sharper drawdowns.
Read more: Crypto Reality in 2025: Why this Market Cycle hits Differently?
BTC Price Prediction: What’s next?
Market outlooks for Bitcoin are currently polarized, with analysts weighing the severe technical breakdown against the long-term bullish narrative driven by institutional adoption. The immediate future of Bitcoin hinges on its ability to defend the critical psychological support at the $100,000 mark.
Bear Case: $92K, $74K, or even $40K
The bearish outlook is primarily driven by the breakdown of major technical indicators and the sustained institutional outflows following the Federal Reserve's cautious tone.
For instance, crypto analyst Damian Chmiel notes that Bitcoin has officially fallen below the support grid marked by the 38.2% Fibonacci retracement and the crucial 200-day Exponential Moving Average (EMA200). This breakdown confirms that the technical terrain has decisively shifted to bearish, thereby opening the road for a critical retest of the $100,000 psychological level.
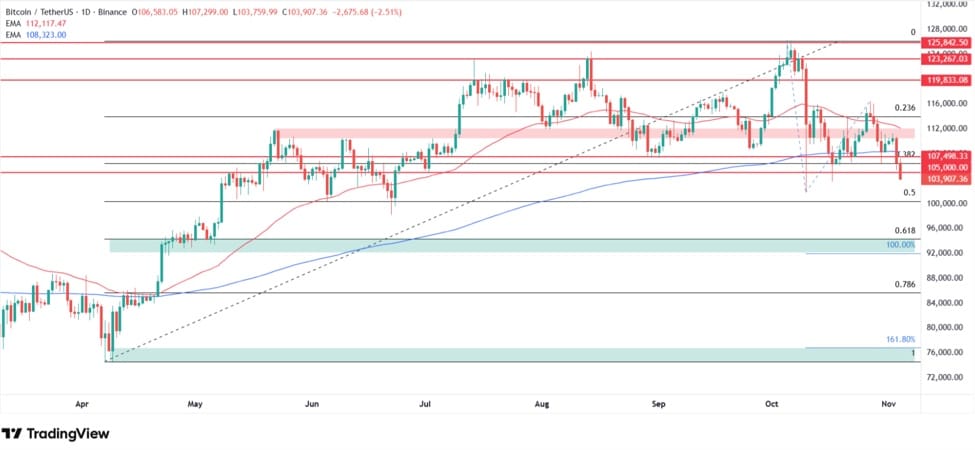
If this $100,000 level fails to hold its ultimate test, stronger depreciation is expected. Chmiel identifies two primary targets:
- The first target is the area of $92,000-$94,000, which aligns with the 61.8% Fibonacci retracement and lows from late April.
- The ultimate target range sits between $74,000-$77,000, coinciding with the April 2025 lows and the 161.8% Fibonacci extension. Consequently, this scenario implies a potential decline of almost 30% from recent levels, effectively erasing the entire upward rally observed over the last six months.
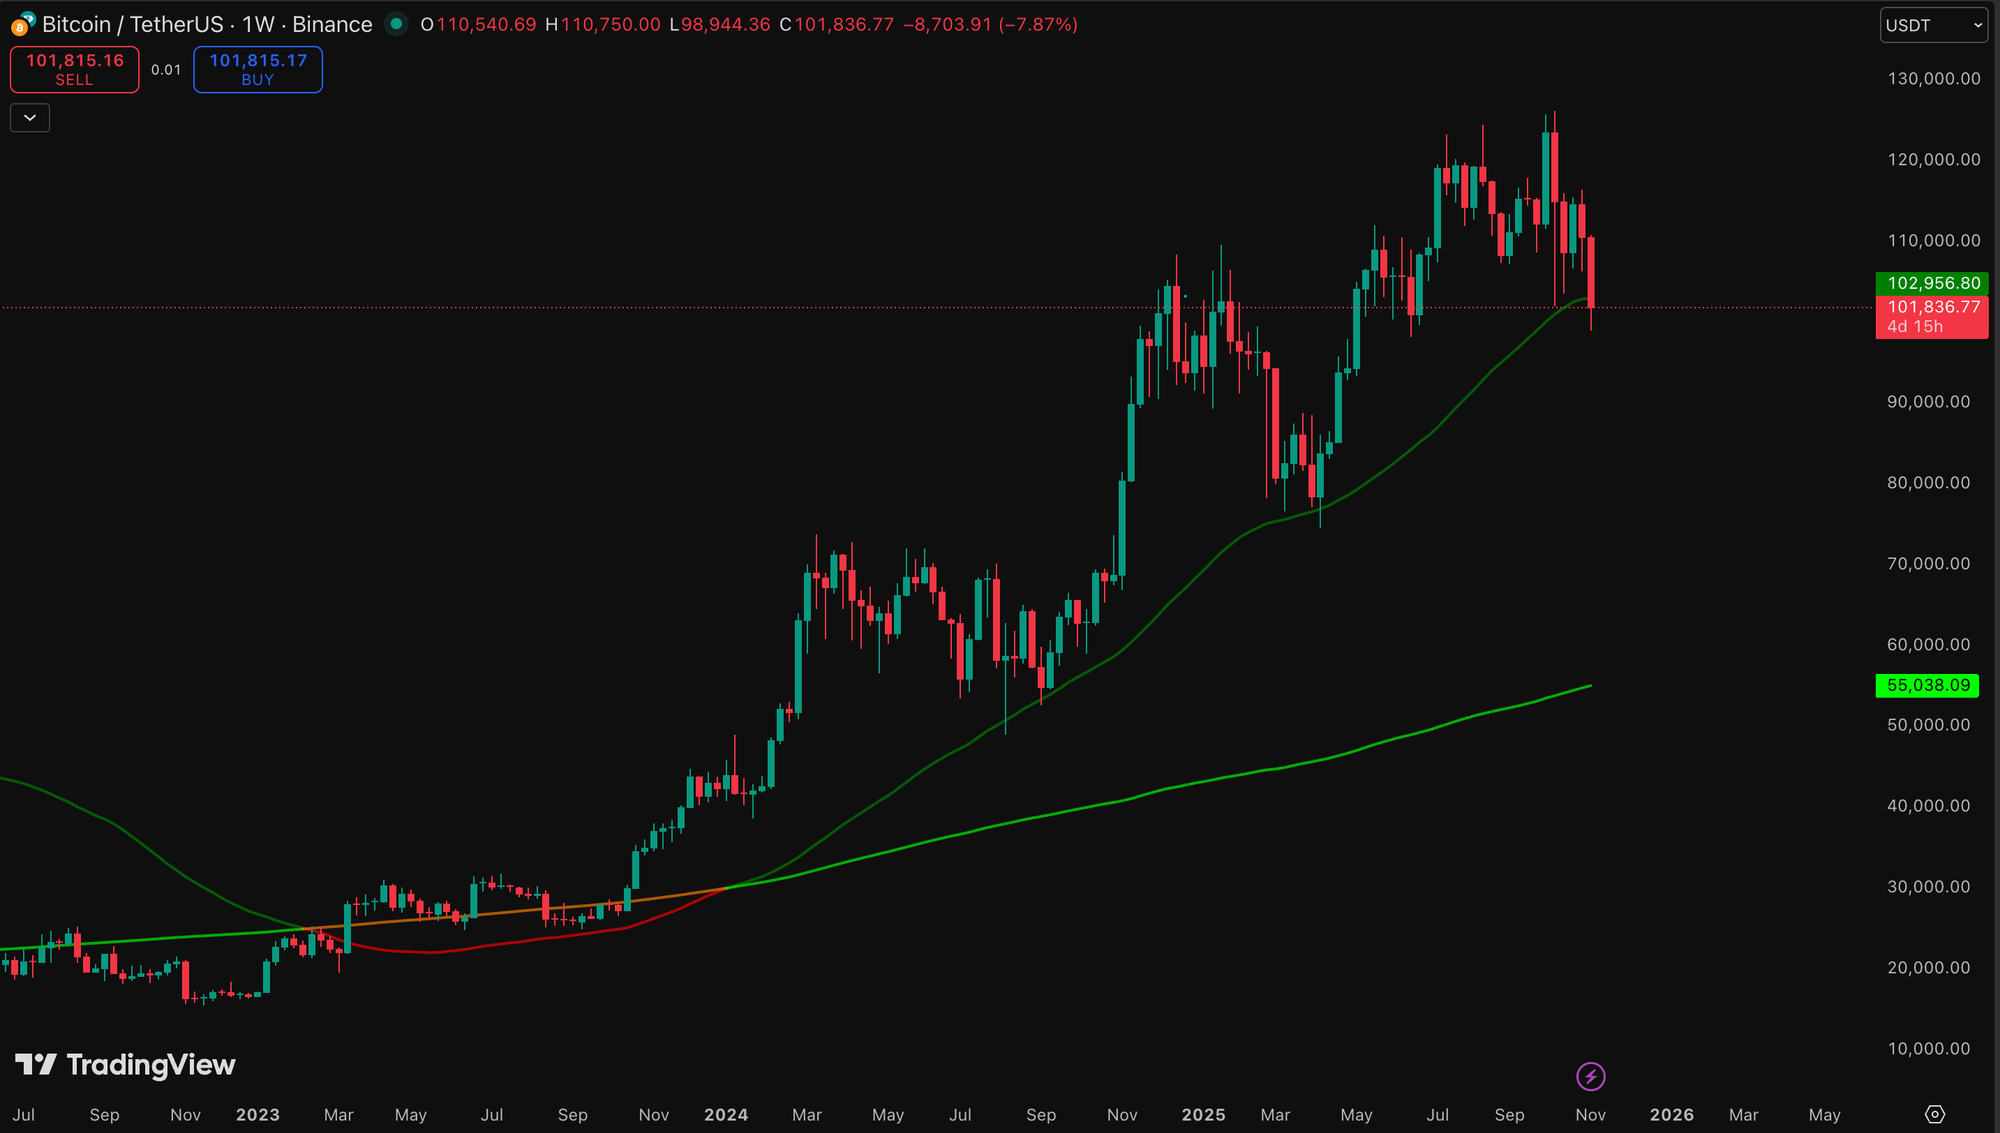
A critical point of concern lies at the weekly timeframe, as Bitcoin is currently testing the 50-week Moving Average (MA50), the final significant structural support. If Bitcoin fails to hold the 50-week Moving Average (MA50) and records two consecutive weekly closes below the $100,000-$102,000 zone, this action will:
- Confirm that a major cycle top was established in October.
- Formalize the onset of a new and severe downtrend.
- Lead to a deeper potential pullback, possibly toward the $40,000 area.
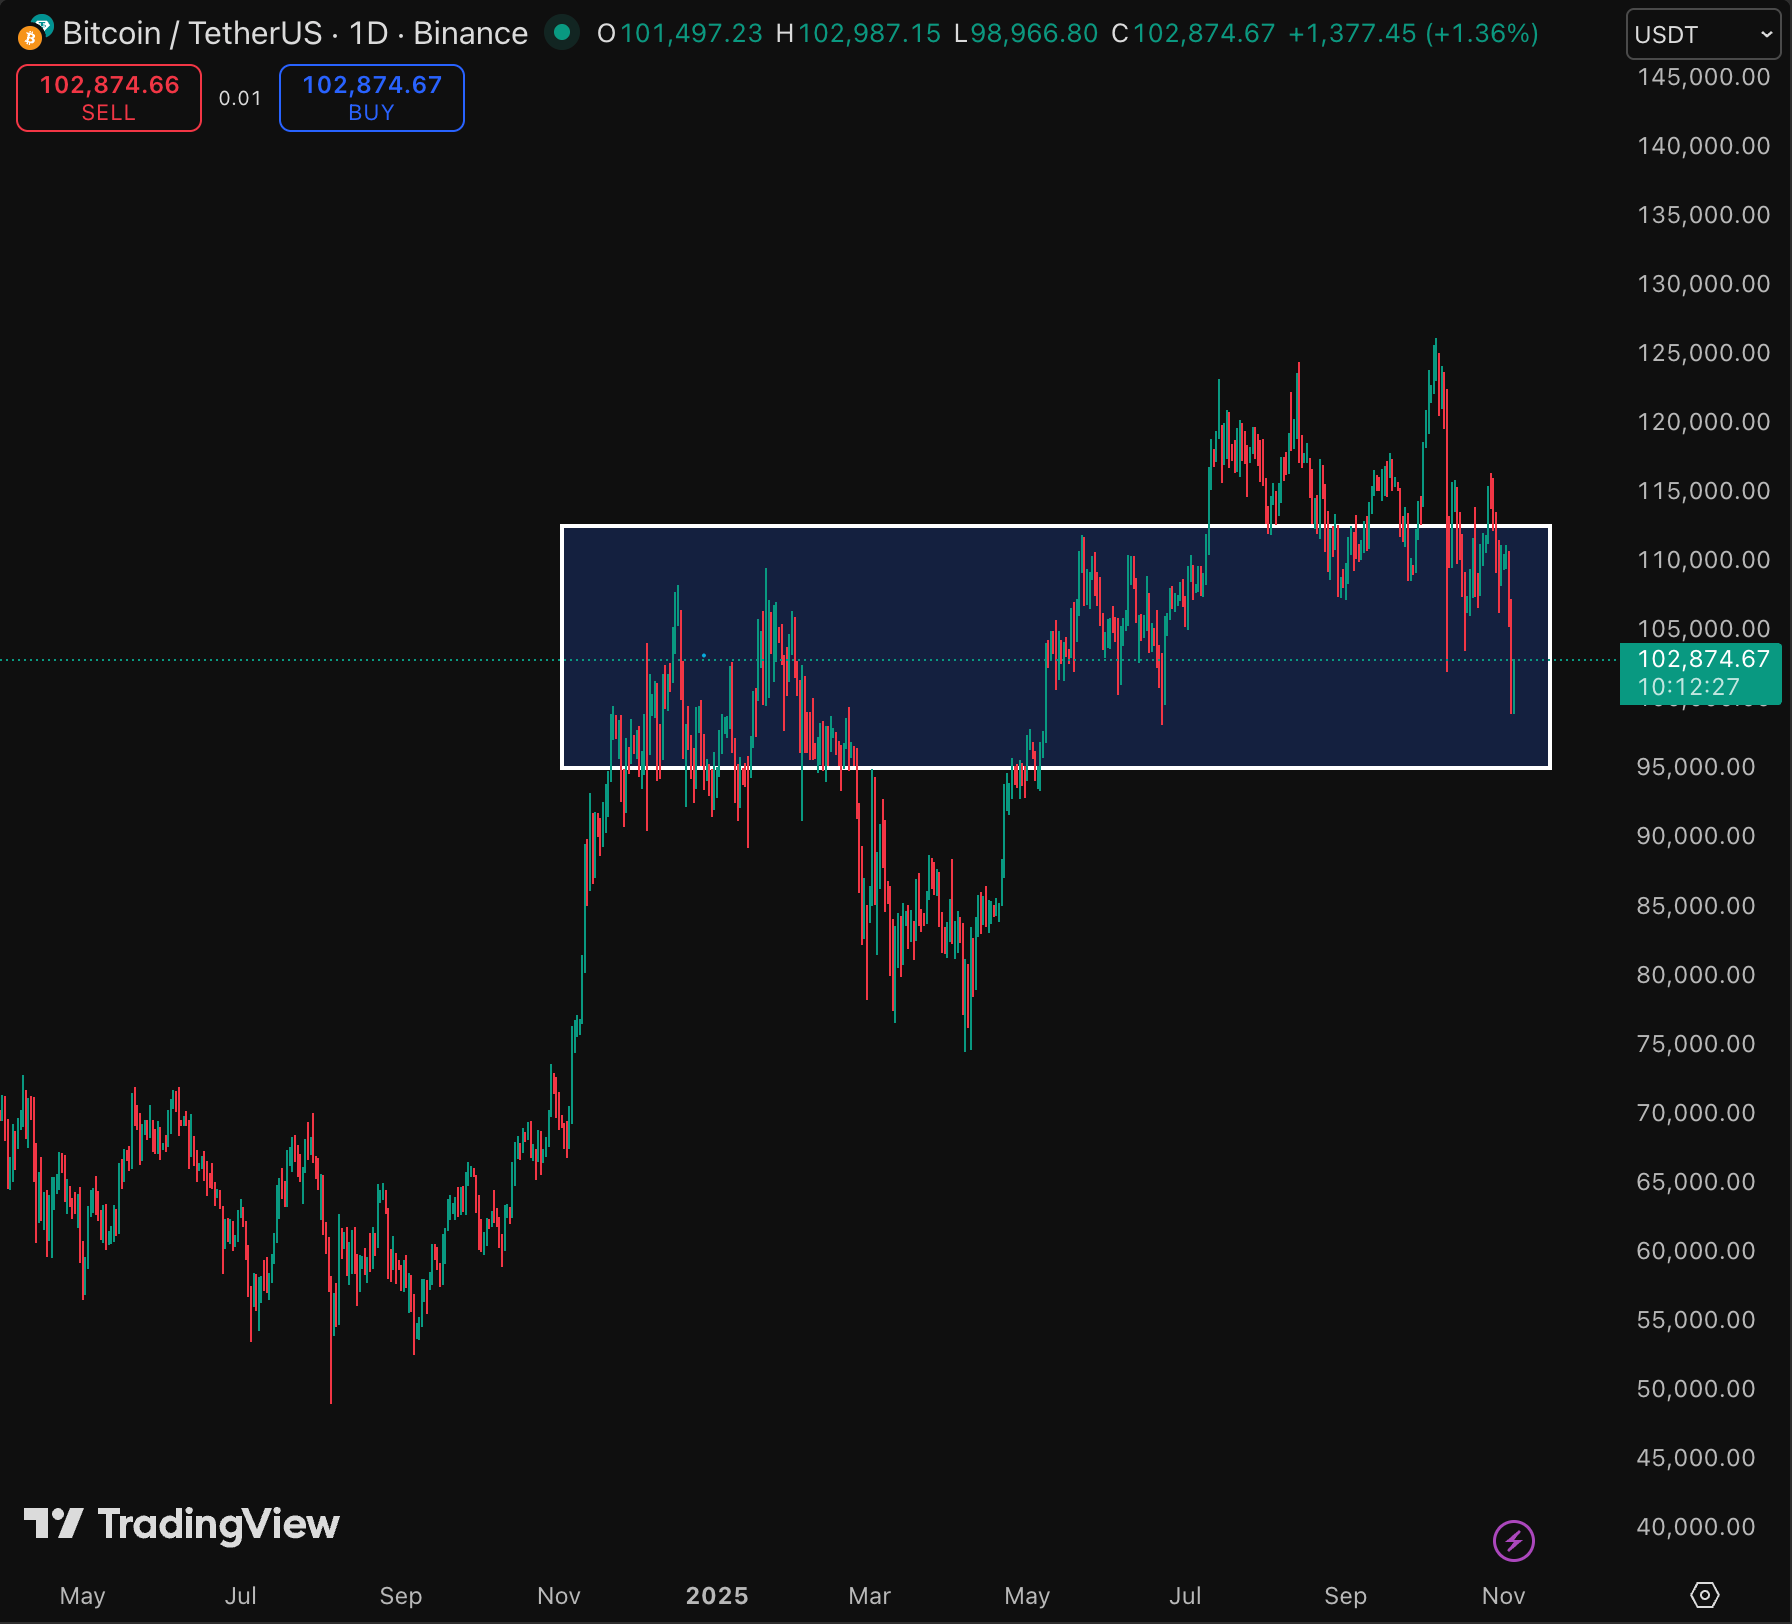
Base Case: Sideways in a $95,000-$112,000 band
Between the bearish breakdown and the bullish recovery scenarios sits a middle path: a multi-week (potentially multi-month) sideways phase as the market repairs liquidity and resets positioning. This is a neutral market scenario of Bitcoin.
In this view, BTC oscillates inside a broad band defined by overhead supply and structural support, roughly $95,000-$112,000 (flexible edges), with failed breakouts and quick mean-reversions as volatility compresses.
What likely ends the range and break the sideways phase:
- Topside: A return to sustained ETF inflows, clearer Fed guidance, and recapture of the $103,000-$105,000 MA cluster with rising spot volume.
- Downside: Renewed macro stress or risk-off headlines that push consecutive weekly closes below $100,000, converting support into resistance.
Bull Case: $103K, $150K, or even higher at $182K
The bullish outlook maintains that the current correction is a necessary consolidation phase within a longer-term bull market, reinforced by fundamental shifts in market structure.
Bitcoin is currently retesting a key long-term moving-average line on the weekly timeframe. Every major upswing since March 2023 has originated from this specific area; therefore, if this long-term trendline holds, the broader uptrend remains intact.
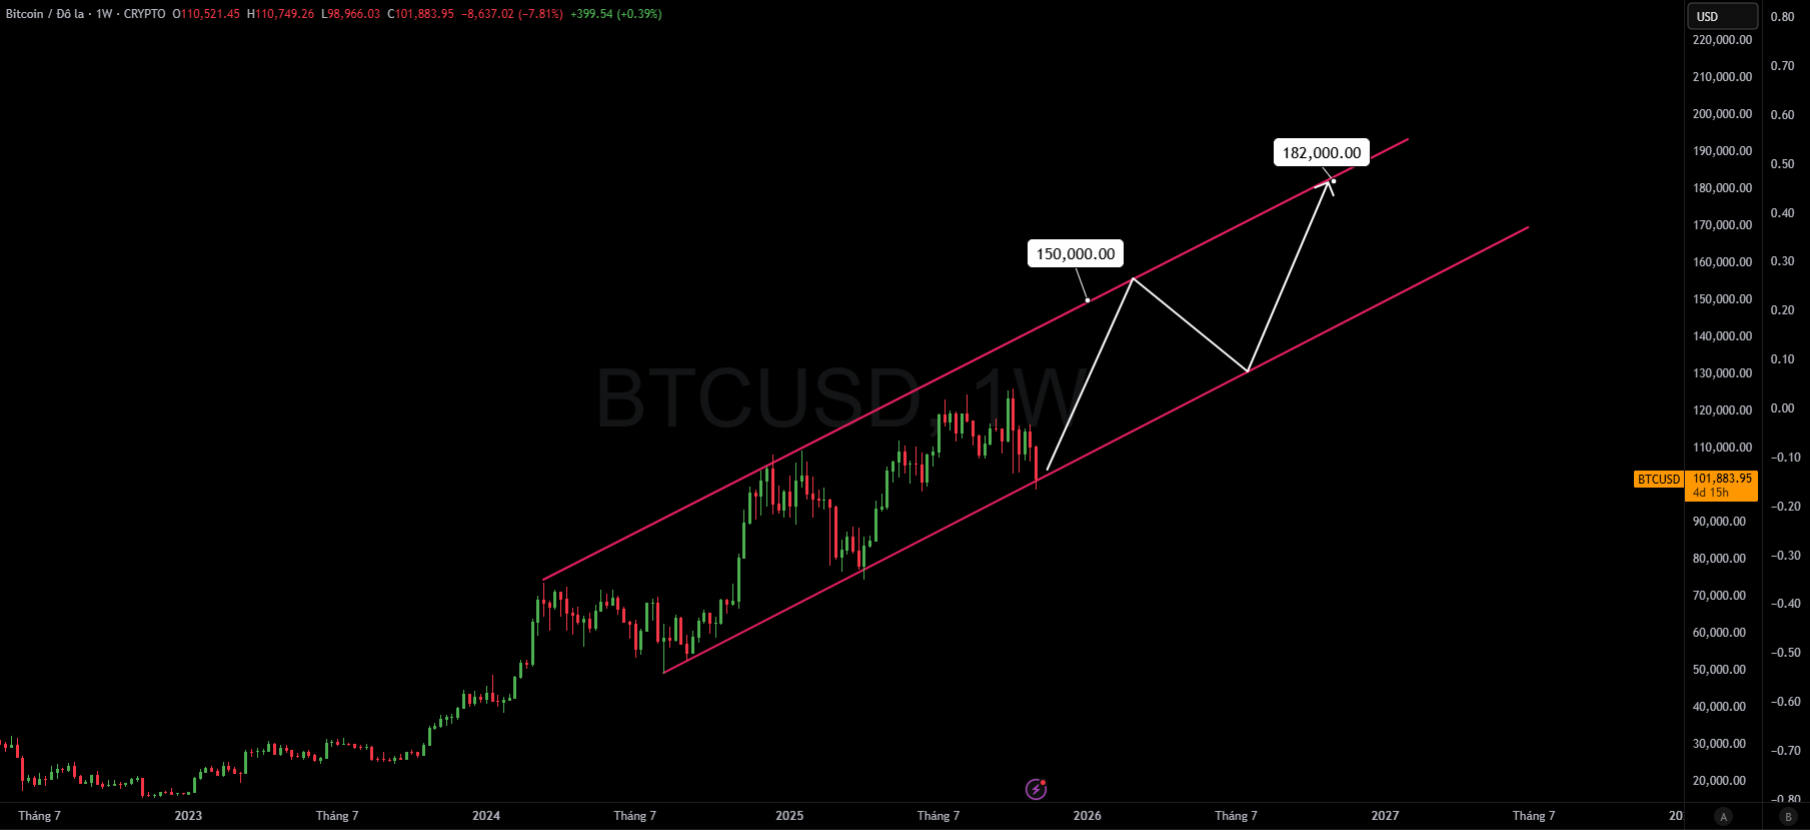
If buyers manage to regain control and hold the key moving average band near $103,000, there will be room for a substantial upward move. The next recovery target in this scenario is placed at $150,000.
According to crypto trader Scott Melker, long-term institutional belief also remains strong, with the average prediction from 17 major financial firms (including Bernstein and Arthur Hayes) sitting at roughly $182,000 per coin by the end of 2025.
“Given that the four-year-cycle anniversary of the 2021 Bitcoin all-time is nigh, many will mistake this period of market weakness and ennui as the top and dump their stack. That is a mistake.” - BitMEX Founder Arthur Hayes wrote.
Conclusion
Bitcoin now stands at a critical juncture. The sharp drop below $100,000 on November 5th, driven by an unprecedented leverage unwind, confirms that extreme volatility is the defining feature of this cycle phase, regardless of strong underlying adoption trends.
Market participants must prioritize risk management during this highly uncertain period. The next few weeks will be crucial in determining whether the $100,000 break signals the start of a deep bear market or simply the final, volatile shake-out before the last rally.
Disclaimer: This article does not contain investment advice or recommendations. Every investment and trading move involves risk, and readers should conduct their own research when making a decision.
FAQs
What primarily caused this sharp BTC price decline?
A mix of macro headwinds (Fed uncertainty and weaker cut odds), ETF outflows, long-term holders selling, technical breakdowns below key MAs, and derivatives deleveraging has amplified downside.
Did BTC dropping below $100K confirm a bear market?
Not automatically. It confirms a major technical break; two weekly closes below $102–100K would strengthen a bearish trend thesis.
If the Bitcoin downtrend continues, how low can BTC go?
Technically, $92,000-94,000 is the first high-probability target if $102,000 fails; deeper stress could reach $74,000-77,000. More extreme scenarios depend on macro shocks & liquidity, which could lead to $40K.
Is Bitcoin rally over?
Not necessarily. The longer-term bull case remains viable if BTC quickly reclaims $103K and puts in higher lows. Failure to do so (and weekly closes below $100,000-$102,000) tilts the balance toward a larger cyclical drawdown.